
Figure 1.
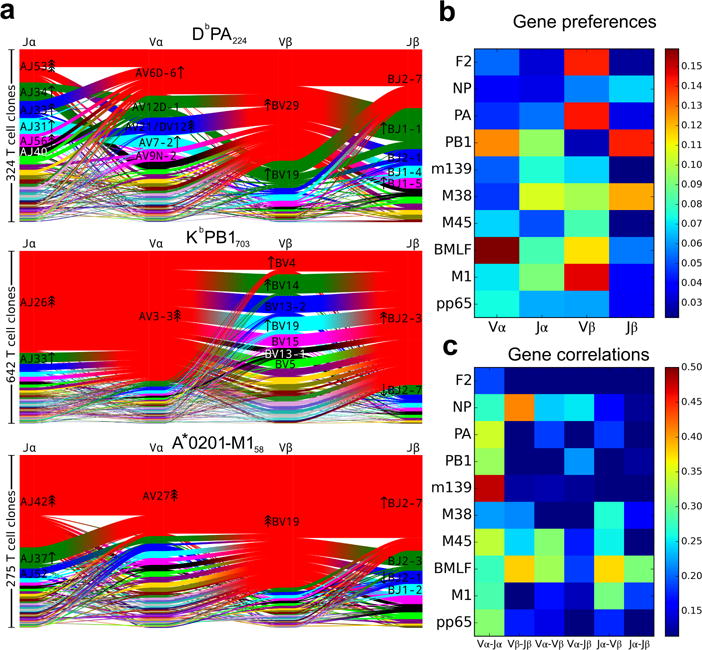
V and J gene segment usage and covariation in epitope-specific responses. a, Gene segment usage and gene-gene pairing landscapes are illustrated using four vertical stacks (one for each V and J segment) connected by curved paths whose thickness is proportional to the number of TCR clones with the respective gene pairing (each panel is labeled with the four gene segments atop their respective color stacks and the epitope identifier in the top middle). Genes are colored by frequency within the repertoire with a fixed color sequence used throughout the manuscript which begins red (most frequent), green (second most frequent), blue, cyan, magenta, and black. The enrichment of gene segments relative to background frequencies is indicated by up or down arrows with arrowhead number equal to the base 2 logarithm of the fold change. b, Jensen-Shannon divergence between the observed gene frequency distributions and background frequencies, normalized by the mean Shannon entropy of the two distributions (higher values reflect stronger gene preferences). c, Adjusted mutual information (AMI) of gene usage correlations between regions (higher values indicate more strongly covarying gene usage). The lower limits of the color ranges in b and c were chosen to highlight significant changes, as described in Methods. A summary of the number of subjects, total number of TCR sequences, and unique TCR clones for each epitope are shown in Extended Data Table 1.