
Figure 2.
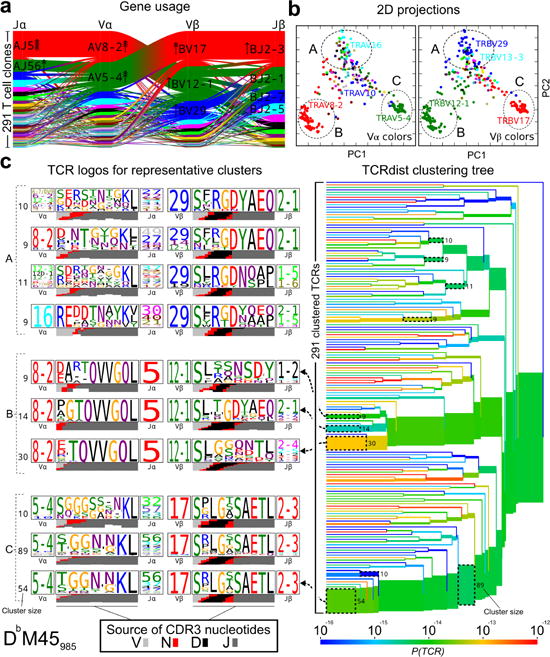
TCRdist analysis of the M45 repertoire identifies clusters of related receptors. a, Gene usage represented as in Figure 1. b, 2D kernel PCA projection of the TCRdist landscape colored by V-alpha (left panel) and V-beta (right panel) gene usage. Three groups of receptors that correspond to TCR logos and clusters depicted in (c) are indicated with dashed ellipses. c, Average-linkage dendrogram of TCRdist receptor clusters colored by generation probability, with TCR logos for selected receptor subsets (the branches enclosed in dashed boxes labeled with size of the TCR clusters). Each logo depicts the V- (left side) and J- (right side) gene frequencies, CDR3 amino acid sequences (middle), and inferred rearrangement structure (bottom bars colored by source region, light gray for the V-region, dark gray for J, black for D, and red for N-insertions) of the grouped receptors. (n=13 mice, 291 TCR clones).