
Figure 4.
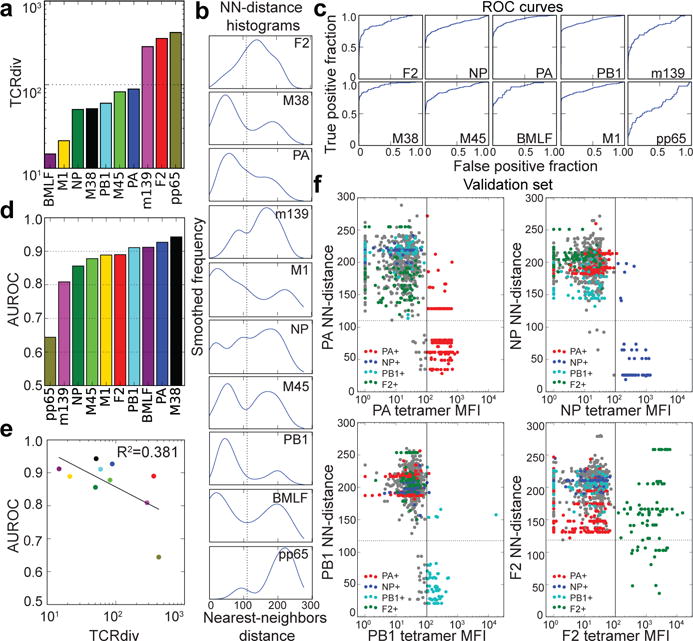
Quantifying the defining features of epitope-specific populations. a, TCRdiv diversity measures and b, smoothed density profiles of the nearest-neighbors (NN) distance are shown for each repertoire. c, Receiver operating characteristic (ROC) curves assess the performance of NN-distance as a TCR classifier, comparing sensitivity and specificity in differentiating epitope-specific receptors from background receptors. d, The area under these ROC curves (AUROC), a standard measure of classification success. e, Correlation between TCRdiv and AUROC. f, Assignment of TCR sequences from influenza infected lungs without prior knowledge of its tetramer specificity by NN-distance classifier. Tetramer binding (mean fluorescence intensity or MFI, x-axis) is plotted against NN-distance score (y-axis) for a validation set of T cell receptors (n=856 TCRs; 352 clones) collected after development of the classifier. The solid vertical lines indicate the MFI thresholds used to define epitope-positive receptors, which are plotted with the colors given in the legend (receptors negative for all four tetramers are shown in gray). Raw MFI values were scaled to align the threshold values across tetramers. Dotted horizontal lines indicating a fixed NN-distance score are provided for visual reference. A summary of the number of subjects, total number of TCR sequences, and unique TCR clones for each epitope are shown in Extended Data Table 1.