
Extended Data Figure 8.
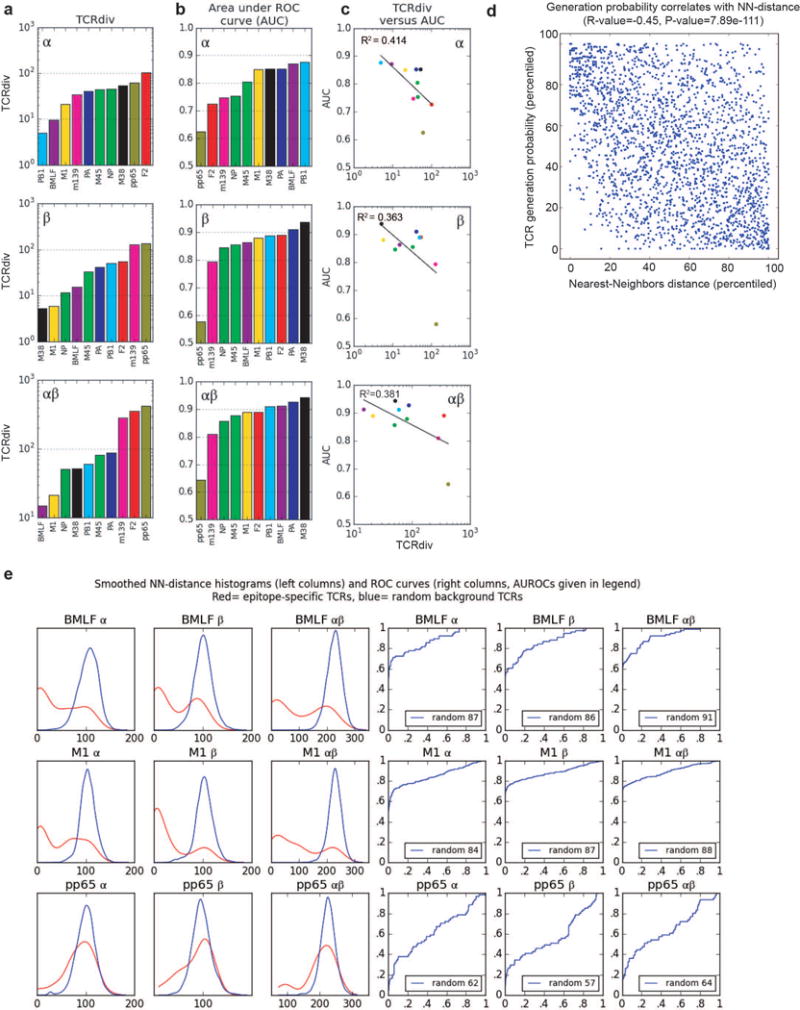
Quantifying the defining features of epitope-specific populations. a, TCRdiv diversity measures; b, the area under the ROC curves (AUC), a standard measure of classification success; and c, correlations between the discrimination AUC and the TCRdiv diversity measure at single and paired chain level. d, Correlation between repertoire sampling density and generation probability. Nearest-neighbors sampling metric for all TCRs in the dataset (x-axis) is plotted against an estimated generation probability (y-axis) based on a simple model of the rearrangement process that accounts for distance from germ line and convergent recombination. The distributions of each measure were normalized (percentiled by rank) within each dataset so that global differences between repertoires do not influence the correlation. e, Quantifying the defining features of human epitope-specific responses. Smoothed, nearest-neighbor distance distributions with respect to the labeled repertoire are plotted in the left three columns for epitope-specific TCRs (red curves) and randomly selected background TCRs (blue curves); TCRdist distances were calculated over the α chain (column 1), the β chain (column 2), or the full receptor (column 3). Plotted in columns 4–6 are receiver operating characteristic (ROC) curves assessing the performance of neighbor-distance as a TCR classifier, comparing sensitivity and specificity in differentiating epitope-specific receptors from randomly selected background receptors (blue ROC curves). Analyses for both single and paired chains are shown, as indicated in the plot labels. A summary of number of subjects, total number of TCR sequences and unique TCR clones analyzed for each epitope are shown in Extended Data Table 1.