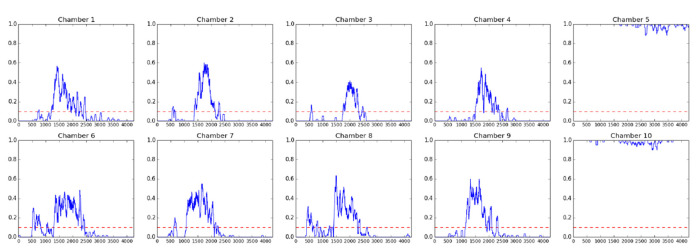
Figure 7. Fractional quiescence (fQ) plots for animals in each chamber.
Each point represents the rolling average of surrounding 60 frames (10 min), when motion is assigned 0 and inactivity is assigned 1. Chamber 5 and chamber 10 did not contain animals, but did contain air bubbles which changed in size while imaging was occurring, which is reported as some movement in the graphs. The x-axis is frame number and the y-axis shows fQ. The red dotted line marks the 0.1 fQ threshold that is used to call entry and exit of lethargus. Here, we show the fQ plots for L4 to adult animals. For fQ plots of animals at other developmental stages, please refer to Figure 1 in a previous report of C. elegans sleep ( Raizen et al., 2008 ).

