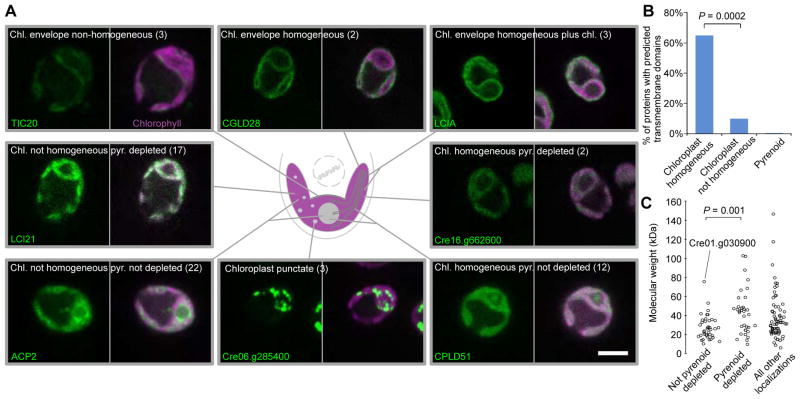
Figure 3. Chloroplast Proteins Show 13 different Localization Patterns.
(A) Representative images of proteins localized to different chloroplast regions. The number of proteins showing each pattern is in parentheses. Scale bar: 5 μm.
(B) The percentage of proteins with predicted transmembrane domains is shown for different localization patterns. Bracket shows a significant difference using Fisher’s exact test.
(C) Predicted molecular weight of proteins is shown as a function of pyrenoid signal intensity. Cre01.g030900 that has a pyrenoid signal and is above the 50 kDa cut-off is labeled. Bracket shows significant difference using a Mann-Whitney U test.

