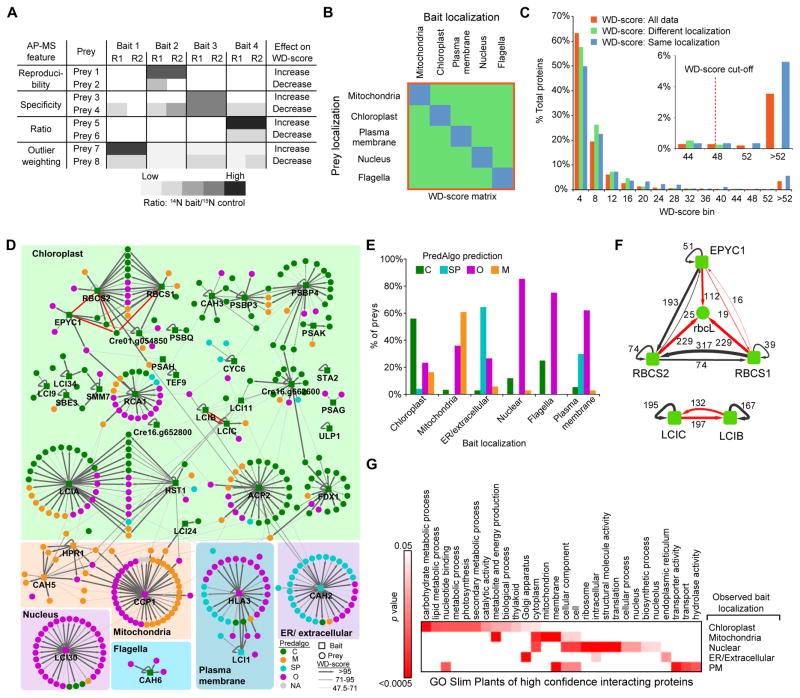
Figure 5. The AP-MS Data are of High Quality.
(A) Illustration of the influence of different AP-MS features (reproducibility, specificity, ratio and outlier weighting) on the WD-score. R1 and R2 represent replica 1 and 2.
(B) To determine a WD-score cut-off value, a bait-prey matrix of WD-scores was formed containing only baits and preys whose localizations were determined in this study. The WD-scores from this matrix were then used to generate (C).
(C) A histogram of WD-scores for “All data,” “Different localization,” “Same localization.” A conservative WD-score cut-off was chosen as the point where all data fell above the highest “Different localization” WD-score. Proteins with a WD-score greater than the cut-off are classified as high confidence interacting proteins (HCIPs).
(D) Protein-protein interaction network of baits and HCIPs. Bait proteins are grouped according to their localization pattern as determined by confocal microscopy. Baits and preys are colored based on their predicted localization by PredAlgo. Previously known interactions are indicated by red arrows.
(E) Comparison of prey PredAlgo predictions with bait localization. C, chloroplast; SP, secretory pathway; O, Other; M, mitochondria.
(F) Confirmation of known interactions from the literature (red arrows). Values are WD-scores.
(G) Significantly enriched gene ontology (GO) terms for interactors of baits localized to different cellular structures.

