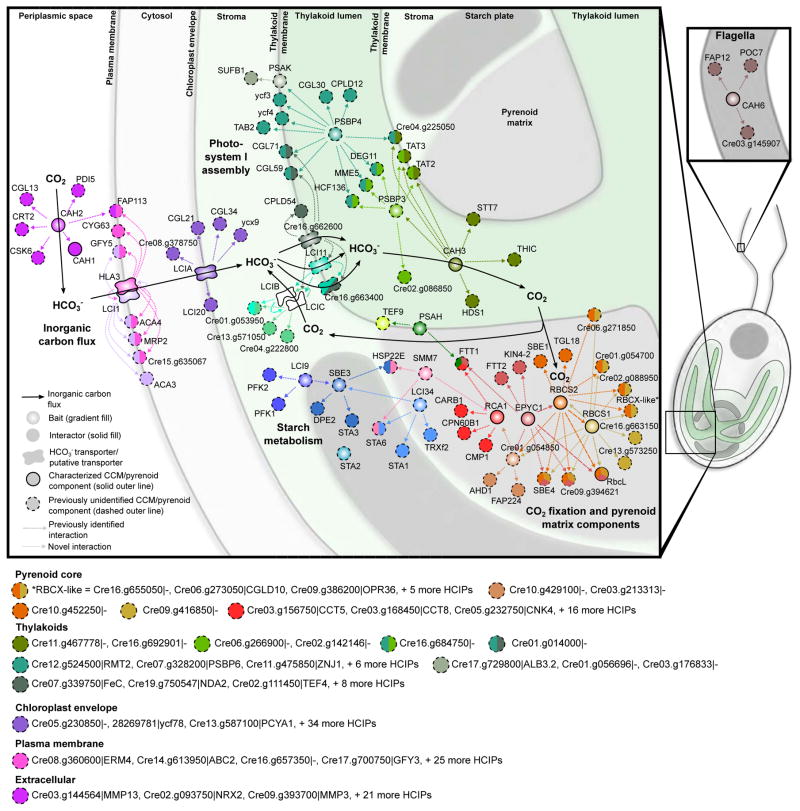
Figure 7. Combining Localization, Protein-Protein Interaction and Protein Function Data Reveals a Spatially Defined Interactome of the Chlamydomonas CCM.
A spatially defined protein-protein interaction model of the CCM. Baits have a gradient fill, prey have a solid fill. Each bait has a unique color. Prey are colored according to their bait, with proteins that interact with multiple baits depicted as pies with each slice colored according to one of their interacting baits. Interactors are connected to their bait by a dashed line representing the direction of interaction. Baits are arranged based on their localization observed in this study. Interactors with predicted transmembrane domains are placed on membranes. Prey of membrane localized baits lacking transmembrane domains are arranged according to their PredAlgo localization prediction. Solid black arrows indicate inorganic flux through the cell. For clarity, a selection of interactors are not included in the map but are highlighted below. All interaction data with corresponding WD-scores can be found in Table S5.

