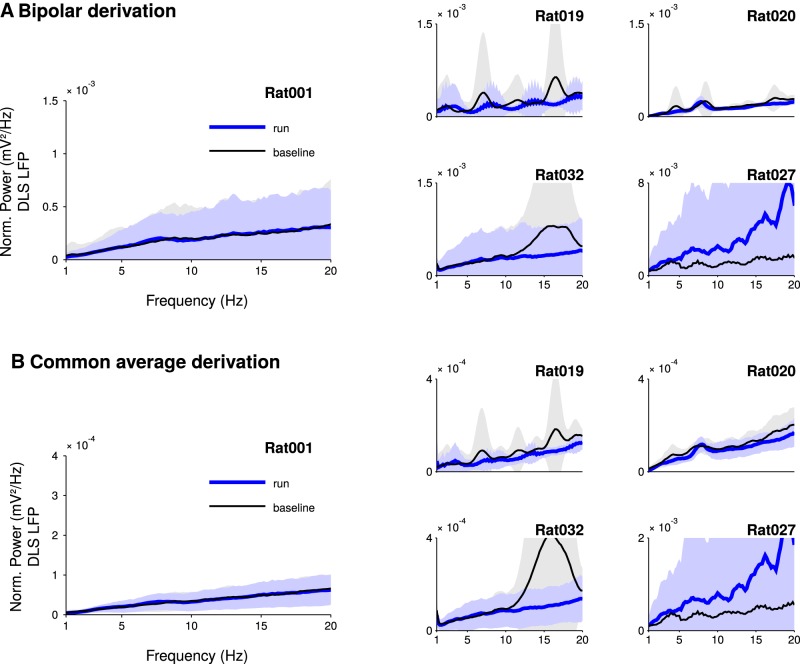
Figure 2.
The prominent peak at theta frequency disappears from power spectra after LFPs rereferencing. A, Striatal LFP power spectra during run and baseline using a neighboring shank or tetrode as reference (mean ± SD, average over electrodes and sessions). B, Striatal LFP power spectra during run and baseline using the common average reference derivation (mean ± SD, average over electrodes and sessions). For A, B, the power was normalized by 1/frequency2. The power in the theta-band is not significantly different in run compared to baseline.

