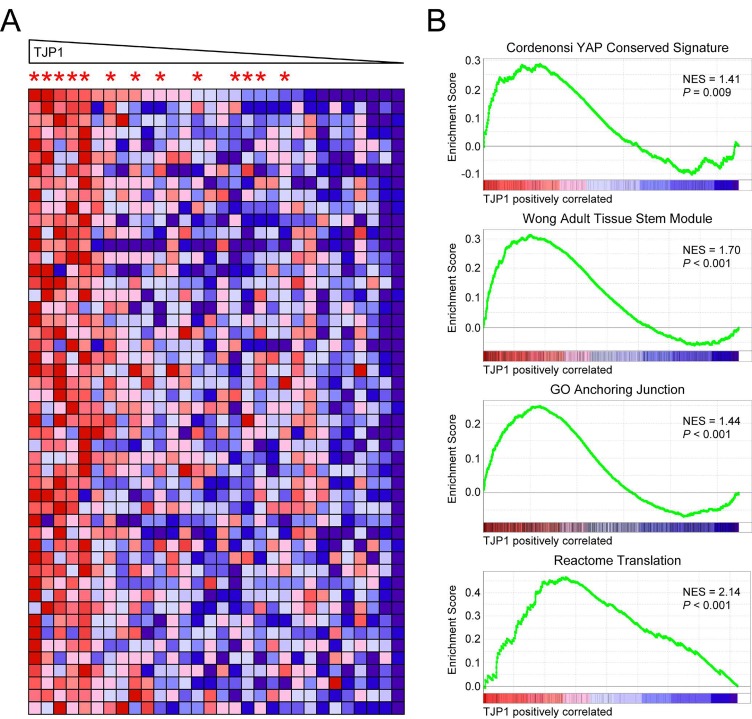
Figure 6. Enriched MSigDB gene sets in MM patients enrolled on the TT3 protocol with high TJP1 levels at relapse.
A. Heat map of TJP1 neighbors for 30 TT3 relapsed samples in the GEO: GSE31161 data set stratified on the basis of TJP1 202011_at probe set levels. Asterisks indicate TJP1-up patients (see Table S1: GSE31161, TT3 samples). B. Enrichment plots of selected gene sets containing genes whose expression is highly correlated with TJP1 expression. NES, normalized enrichment score.

