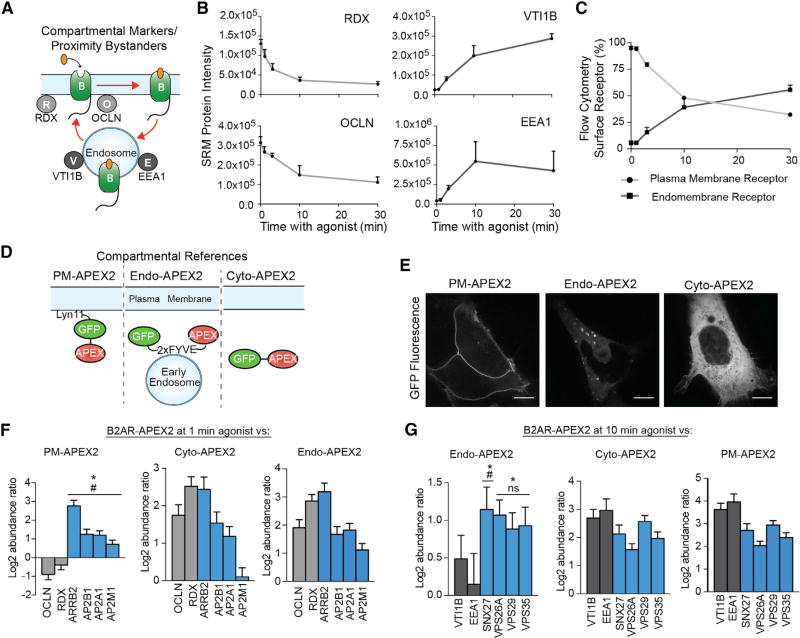
Figure 3. Spatially Specific References Allow GPCR Interactors to be Differentiated from General Compartmental Proteins.
(A) Compartmental bystanders along the agonist-stimulated B2AR (“B”) trafficking route: RDX and OCLN at the plasma membrane and EEA1 and VTI1B at endosomes.
(B) Targeted proteomics analysis of compartmental protein bystanders biotinylated in B2AR-APEX2 cells in unstimulated cells or cells stimulated with isoproterenol for the noted times prior to biotinylation. Data from four independent experiments are presented as mean + SEM.
(C) Flow cytometric measurements of agonist induced B2AR-APEX2 trafficking. Data from three independent experiments are presented as mean + SEM.
(D) APEX-tagged constructs targeting APEX2 to the plasma membrane, early endosome, or cytoplasm.
(E) Micrographs of PM-APEX2, Endo-APEX2, and Cyto-APEX2 using live-cell confocal imaging (scale bar, 10 µm).
(F and G) Relative protein abundance of biotinylated receptor-specific protein complexes (blue bars) or plasma membrane bystanders (light gray bars) comparing B2AR-APEX2 after (F) 1 min agonist stimulation or (G) 10 min agonist stimulation to PM-APEX2, Cyto-APEX2, or ENDO-APEX2 measured by targeted proteomics analysis. Statistical significance was calculated using one-way ANOVA (alpha = 0.05) with multiple comparisons correction. Differences in protein abundance between receptor-specific protein complexes and bystanders noted as (F) OCLN (#) and RDX (*) or (G) VTI1B (#), and EEA1 (*). Data from four independent experiments are presented as mean + SEM.
See also Figures S2 and S3 and Tables S2 and S5.

