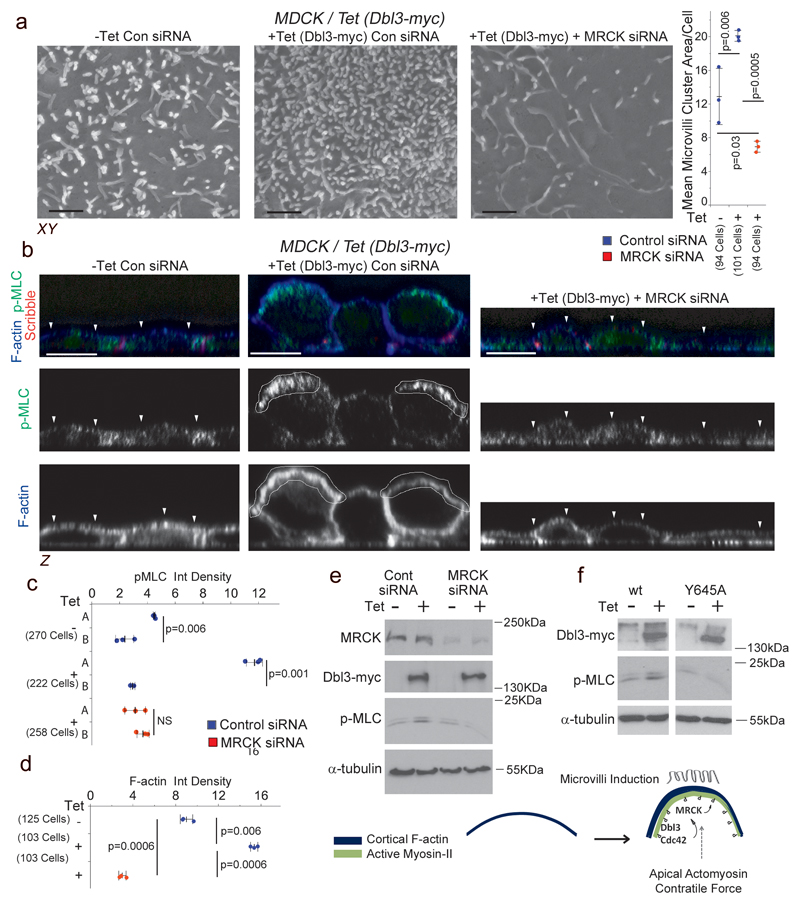
Figure 3. MRCK functions as an effector of Dbl3-Cdc42 signalling.
(a) Scanning electron microscopy analysis of microvilli induction by MDCK cells with tetracycline-inducible Dbl3-myc expression transfected with MRCK siRNA determined by measuring areas of microvilli clusters from SEM scans. (b-d) Induction of active Myosin at cortical caps (A) or basal membrane (B), and enrichment of F-actin at the apical cortex during polarization and differentiation, stimulated by conditional expression of Dbl3-myc with or without MRCK siRNA knockdown. White arrowheads highlight the apical membrane cortex labelled for F-actin. (e) Immunoblot analysis of total active Myosin levels following conditional expression of Dbl3-myc and siRNA knockdown of MRCK. (f) Immunoblot analysis of total active Myosin-II levels following conditional expression of Dbl3-myc or GEF inactive Dbl3Y645A-myc. The schematic illustrates the formation of apical caps formed by activated Myosin-II and F-actin. Unprocessed original scans of blots are shown in Supplementary Figure 8. For all quantifications, n=3 independent experiments and shown are the data points, means ± 1 SD (in black), the total number of cells analysed for each type of sample across all experiments, and p-values derived from t-tests. Scale bars: a, 1μm; b, 10μm.

