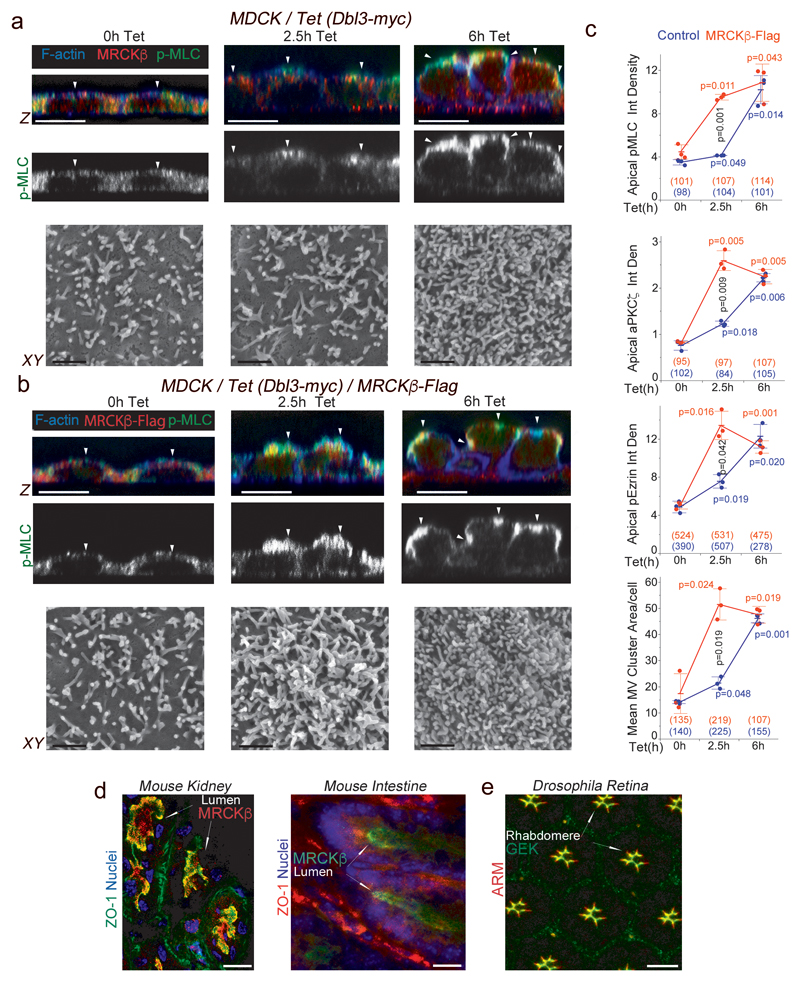
Figure 4. Cdc42 activates MRCK apically, stimulating apical Myosin-II activation and differentiation.
(a-c) Analysis and quantification of apical pMLC, aPKCζ and pEzrinT567 at the apical membrane domain using confocal z-section analysis and of brush border induction using scanning electron microscopy of MDCK cells with tetracycline-inducible Dbl3-myc expression with or without constitutive expression of MRCKβ-flag. White arrowheads highlight the apical membrane cortex labelled for F-actin. (d) Localization of MRCKβ in mouse kidney and small intestine. (e) Localization of Gek in polarizing pupal Drosophila photoreceptors. For all quantifications, n=3 independent experiments and shown are the data points, means ± 1 SD, the total number of cells analysed for each type of sample across all experiments, and p-values derived from t-tests (red/blue values refer to comparisons within categories and black value to comparisons between categories after 2.5h). In panels d and e, arrows point to apical domains positive for MRCK/Gek. Scale bars: electron micrographs, 1μm; confocal immunofluorescence images, 10 μm.

