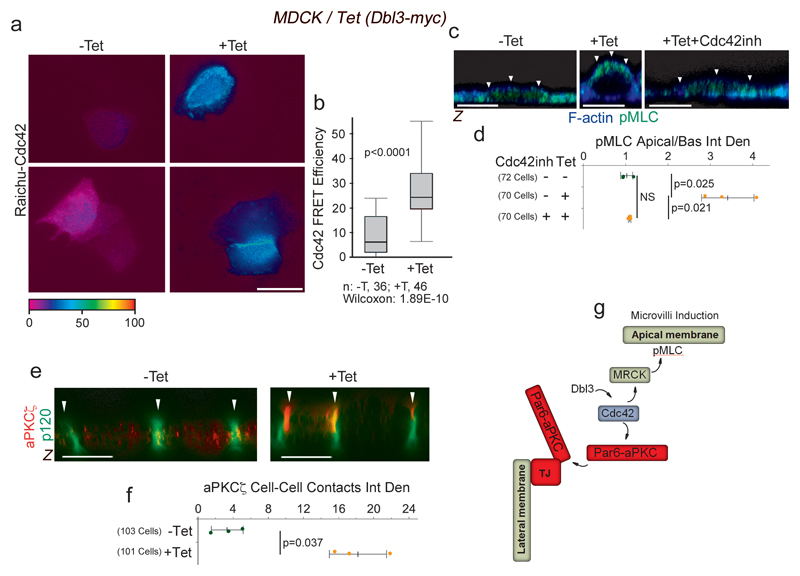
Figure 5. Dbl3 and Cdc42 drive apical actomyosin activation and aPKC recruitment.
(a,b) FRET analysis of Cdc42 activity at the apical aspect of MDCK cells conditionally expressing Dbl3-myc. (c,d) Confocal microscopy of pMLC and F-actin at the apical membrane domain of MDCK cells conditionally expressing Dbl3-myc induced with tetracycline in the absence or presence of Cdc42 inhibitor. White arrowheads highlight the apical membrane cortex labelled for F-actin. (e,f) Analysis of aPKCζ localization in MDCK cells with tetracycline-inducible Dbl3-myc expression. White arrowheads point to the lateral junctional complex. (g) Schematic diagram illustrating activation of two effector mechanisms, MRCK/Myosin-II and Par6-aPKC by Dbl3 stimulated apical Cd42-activation. Quantifications show shown are (b) box blots (25th to 75th percentiles, with a line at the median; whiskers extend to the max/min data points; n=36 cells -Tet and n=46 cells +Tet; p value was calculated with a Wilcoxon test), or (d, f) based on n=3 independent experiments and showing the data points, means ± 1 SD (in black), the total number of cells analysed for each type of sample across all experiments, and p-values derived from t-tests. Scale bars: 10 μm.

