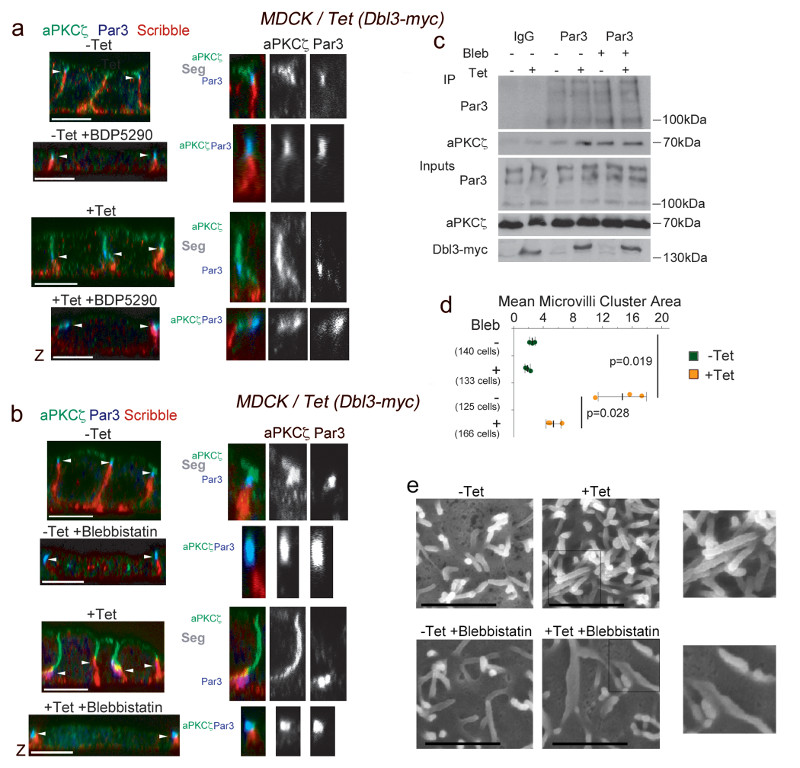
Figure 7. MRCK-stimulated Myosin-II activation drives PAR separation at tight junctions.
(a,b) Confocal analysis of aPKCζ localization at tights junctions in medium/advanced polarizing/differentiating MDCK cells with tetracycline-inducible Dbl3-myc expression without or with (a) BDP5290, a MRCK inhibitor, or (b) blebbistatin, a Myosin-II inhibitor. The position of tight junctions, demarked by Par3, is indicated by white arrowheads. Note, tight junctions move towards the basal membrane in response to apical expansion17. The larger magnifications show examples of cells in which aPKC segregates from Par3 (all controls and enhanced by Dbl3-myc expression) or in which aPKC and Par3 co-localise (cells treated with MRCK or Myosin-II inhibitor). aPKCζ segregation from Par3 at tight junctions is highlighted by ‘Seg’. (c) Immunoprecipitation analysis of aPKCζ-Par3 complex formation in cells conditionally expressing Dbl3-myc with or without blebbistatin. Note, increased Par3-aPKC complex formation in Dbl3-myc-induced cells without blebbistatin is due to increased transient interactions that promote apical expansion17. (d,e) Quantification of microvilli induction in MDCK cells conditionally expressing Dbl3-myc -/+ Myosin-II inhibition. The quantification in panel d is based on n=3 independent experiments and shown are the data points, means ± 1 SD (in black), the total number of cells analysed for each type of sample across all experiments, and p-values derived from t-tests. Unprocessed original scans of blots are shown in Supplementary Figure 8. Scale bars: electron micrographs, 1μm; confocal immunofluorescence images, 10 μm.

