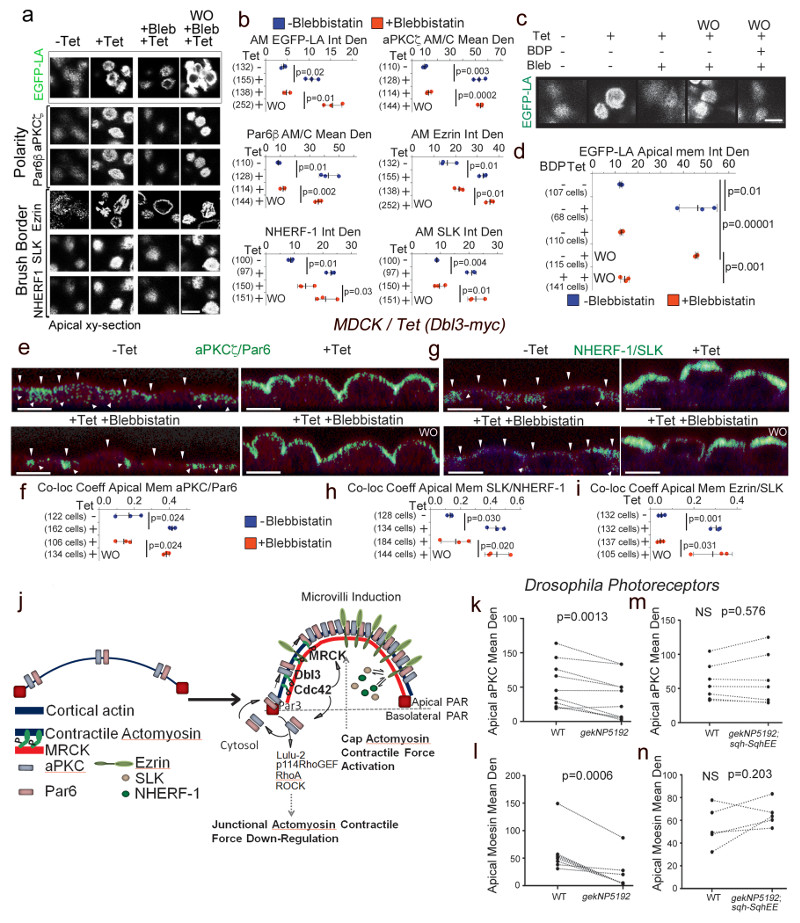
Figure 8. MRCK-activated actomyosin contractility drives apical PAR segregation and polarization of cytosolic factors.
(a,b) Levels of EGFP-Lifeact (EGFP-LA), Par polarity and brush border proteins localized at the apical membrane domain in MDCK cells conditionally expressing Dbl3-myc, treated with blebbistatin and followed by washout (WO). (c,d) Levels of EGFP-Lifeact (EGFP-LA) enrichment at the apical membrane domain of MDCK cells conditionally expressing Dbl3-myc following blebbistatin treatment and washout in the absence or presence of BDP5290 to inhibit catalytic activity of MRCK. (e-i) Measurements of co-localization coefficients of PAR polarity and brush border proteins at the apical membrane domain in MDCK cells conditionally expressing Dbl3-myc transiently inhibited with blebbistatin followed by wash out for 2 hours (green indicates co-localisation, see also Supplementary figures 5 and 6; arrowheads point to apical membrane). (j) Schematic model of polarity induced by apical stimulation of Cdc42, activating a dual effector mechanism to generate asymmetric actomyosin contractions, apical PAR domain formation and membrane morphogenesis. Bright green represents co-localization of Par and brush border proteins. (k-n) Quantification of confocal sections of pupal retinas stained for the apical markers aPKC and Moesin comparing wild type cells and gek mutant cells (k, l), or wild type cells and cells mutant for gek expressing SqhEE (m, n). Quantifications in panels b, d, f, h, and i are based on n=3 independent experiments and shown are the data points, means ± 1 SD (in black), the total number of cells analysed for each type of sample across all experiments, and p-values derived from t-tests. Quantifications in panels k-n of protein expression levels compare measurements from wild type and neighbouring mutant cells (paired within sections; see Supplementary Fig. 7 for representative images); k, n=10 animals; l, n=8 animals; m and n, n=7 animals; p values were calculated with t-tests). Scale bars: 10 μm.

