

Abstract
Objective
K-shell x-ray fluorescence (KXRF) techniques have been used to identify health effects resulting from exposure to metals for decades, but the equipment is bulky and requires significant maintenance and licensing procedures. A portable x-ray fluorescence (XRF) device was developed to overcome these disadvantages, but introduced a measurement dependency on soft tissue thickness. With recent advances to detector technology, an XRF device utilizing the advantages of both systems should be feasible.
Approach
In this study, we used Monte Carlo simulations to test the feasibility of an XRF device with a high-energy x-ray tube and detector operable at room temperature.
Main Results
We first validated the use of Monte Carlo N-particle transport code (MCNP) for x-ray tube simulations, and found good agreement between experimental and simulated results. Then, we optimized x-ray tube settings and found the detection limit of the high-energy x-ray tube based XRF device for bone lead measurements to be 6.91 μg g−1 bone mineral using a cadmium zinc telluride detector.
Significance
In conclusion, this study validated the use of MCNP in simulations of x-ray tube physics and XRF applications, and demonstrated the feasibility of a high-energy x-ray tube based XRF for metal exposure assessment.
Keywords: x-ray fluorescence, XRF, bone lead, metals, exposure assessment, in vivo, lead
1. Introduction
K-shell x-ray fluorescence (KXRF) bone Pb measurement systems have widely expanded our knowledge of Pb and its health effects over the past few decades. The most advanced system uses a Cd-109 source with a cloverleaf detector geometry and has a detection limit of 2–3 μg g−1 bone mineral (Nie et al 2006). The KXRF measurement system has had many upgrades over the years, but overall remains the same with the same limitations in portability, lengthy measurement times, and use of a radioisotope source. The KXRF measurement system uses liquid nitrogen cooled high-purity germanium detectors, which make the system itself very large, especially when including the amplifiers and computer required to take the measurement. Along with this, the radioisotope source requires site-specific licensing from a national regulating authority, health physicist inspections, and experiences source degradation over time. This presents a problem for populations without the ability to go to a specific location for measurement, and labs that are unable to dedicate the time and effort to maintain a working device. A portable XRF system using an x-ray tube and Si detector has overcome these disadvantages, but introduced problems with overlying skin thickness (Specht et al 2014). The detection limit of the portable XRF increases dramatically with thickness of soft tissue, and, thus, has limitations for populations able to be measured. Advances in detector and x-ray tube technology would allow for the combination of the advantages of both the KXRF and portable XRF bone Pb measurement systems to be transferred to a device that excluded the main disadvantages of both. Using an x-ray tube source and different detector material would allow a system to be on the portable scale, which opens the possibility of measurement of at risk populations such as the elderly who may not be able to easily access a stationary device. Then, by using the high-energy x-rays associated with KXRF Pb measurements, the issues with soft tissue thickness are reduced. X-ray tubes have the capability of producing high-energy spectra through the use of high Z target materials, such as Uranium. Alternative detector materials, such as Cadmium Zinc Telluride (CdZnTe) or Silicon (Si), offer advantages of operation at room temperature with trade-offs in detector resolution and efficiency. In this study we used Monte Carlo simulations to determine the feasibility of an in vivo x-ray tube based KXRF bone Pb measurement system and determine its estimated sensitivity to compare to the current Cd-109 based KXRF and portable XRF measurement systems.
2. Materials and methods
2.1. Monte Carlo simulations
The Monte Carlo simulation program, Monte Carlo N-particle transport code (MCNP), used in our study was developed by Los Alamos National Lab and distributed by the Radiation Safety Information Computational Center. This software has recently been updated to more accurately depict interactions at lower energies, using its default database for interaction cross-sections. This includes Doppler broadening effects and all interactions observed in XRF. This gives us the ability to simulate an x-ray tube source with electron to photon conversion in the target and XRF signals generated. MCNP has the ability to set unique materials, densities, geometries, and sources in order to reproduce an experimental setup.
We first verified the ability to replicate experimental observances using MCNP, and then we used it to optimize system parameters and test feasibility of instruments in this study.
2.1.1. Validation of MCNP using a portable XRF experimental comparison
We tested the ability of MCNP to accurately reproduce an x-ray tube spectrum by simulating the portable XRF device used in our previous work (Specht et al 2014, 2016). This device should be a good validation for MCNP’s ability to depict the electron photon conversions in an x-ray tube. We measured the x-ray tube output using a high-purity germanium (HPGe) detector. To reduce dead time of the detector, we placed the x-ray tube 10 cm away. We recreated this setup in MCNP. We started with electrons hitting the Ag x-ray target and proceeding through the filters and collimators inherent in the device. We also needed to take into account the attenuation of the x-rays through air and the aluminum window of the HPGe detector before being detected. By taking the experimental measurement and comparing it to our simulation result by looking at spectral features we can validate the ability of MCNP to reproduce an x-ray tube source. Successful validation of this comparison allows us to use MCNP in other applications of x-ray tube simulations and reproduce potential experimental results for x-ray tube systems.
2.1.2. High-energy x-ray tube based KXRF measurement system
The x-ray tube based KXRF system we modeled had specifications chosen based on simulation and calculations shown in the results section, and has geometry shown in figure 1. The system utilized a 90° geometry between the x-ray source and detector. The x-ray tube had an accelerating voltage of 220 kV, a 0.56 mm transmission Uranium target, and a 1 cm tungsten collimator. The target thickness was modeled and found to maximize K-shell fluorescence from the Uranium target, while minimizing the low energy bremsstrahlung interactions creating excess background in the Pb peak areas and radiation dose. The detector was modeled as Si, CdZnTe and HPGe, each with 1 cm thickness and a 3.2 cm diameter. We used this as a comparison tool even though in practice a Si detector would be much smaller than our specified dimensions. The leg was modeled with tibia bone of diameter 1.3 cm based on data in ICRP 70, with soft tissue with a radius of 50 mm and thickness of 4.8 mm at the thinnest point surrounding the bone (ICRP 1995, Pejović-Milić et al 2002).
Figure 1.
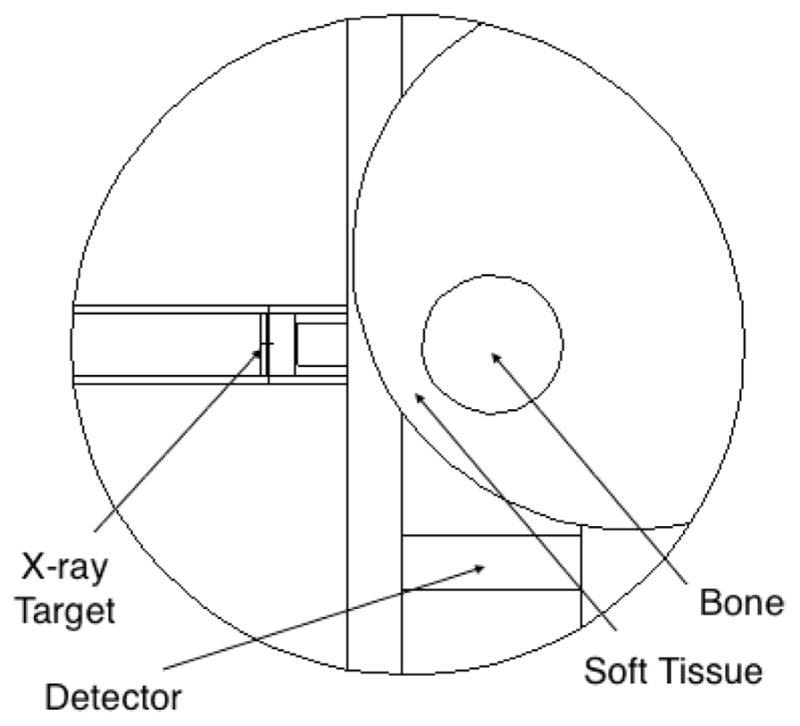
Simulated KXRF setup with x-ray tube source and detector in 90° geometry and bone shown in the ‘halfway’ geometry.
The leg was simulated with an approximate skin distribution where the thickness of skin increased around the leg with the thinnest portion at the shin as shown in figure 1. The geometry of the leg was optimized using a comparison of changing the thinnest soft tissue from pointing towards the source to pointing towards the detector. Figure 1 shows the thinnest section of soft tissue being about halfway between source and detector. This geometry is used as a conservative estimate of the tibia bone and soft tissue, as the thinnest portion of soft tissue would extend longer over the bone than we have shown using a cylindrical estimation for the tibia bone. The tibia bone close to the surface of the leg is flatter with respect to the surface and has a triangular prism shape rather than the cylinder depicted in our simulation. The tibia bone we simulated had a Pb concentration of 100 ppm, which we used to compare signal between different materials and experimental devices using standards of the same concentration.
Two separate simulations were performed: (1) to model the initial spectrum of x-rays from the x-ray tube source and (2) to simulate the XRF interaction in leg and collected signal in the detectors. The results from the first simulation were used to create the x-ray source in the second. This allowed us to get much better statistics on the final spectra collected in the detectors. The final simulation used Si, Ge, and CdZnTe detectors separately to demonstrate differences between them. The detectors were all modeled with the same standard size of 3.2 cm diameter and 1 cm thickness to match the standard KXRF detector (Chettle et al 1991).
2.1.3. Normalization of simulation data to experimental results
The normalization of the simulation data is critical to getting accurate results when comparing with experimental data. For the validation section of this study, ideally one would do an assessment of normalization starting from a given number of electrons or amperes in the x-ray tube, but given the amount of geometry variables and unknown beam dispersion, this was too difficult. Thus, for this simulation we used a general ratio of low energy and high-energy spectral features to find a normalization factor. A similar method is used in other studies using MCNP (Salgado et al 2006). The main interest for our simulation is the shape of the spectral features, which confirm the x-ray production, filtration, and attenuation of the beam. These are the key features needed to identify a good comparison between simulation and experiment for our further tests.
In our simulation of the high-energy x-ray tube based KXRF system, the normalization was easier. For this simulation, we could normalize using dose. We started by using a skin dose of 40mSv to a 1 cm2 area as our limiting factor and target for normalization since this is the dose associated with the peak activity Cd-109 source used in KXRF systems. Normalizing our simulation to the same dose as a Cd-109 KXRF measurement would then give an accurate comparison of the signal from Pb collected by either system without accounting for detector resolution, resolving time, and background. We did a dose simulation for our x-ray tube and found a skin dose of 9.8 × 10⁻¹³ Sv per particle. We then normalized our dose based on the number of particles it would take in the x-ray tube to reach a skin dose of 40 mSv, and found we needed to use 4.1 × 10¹⁰ particles in our simulation to reach this dose. Many starting particles end up not interacting in the detector either by not producing x-rays initially or by producing x-rays that scatter away from the detector. The simulation gave us values for the probability of any starting particle being finally absorbed in the detector. Finally we could multiply this number, which was approximately 3 × 10⁶, by the known probability distribution of each channel, which was obtained from the output of the simulation. This gave us the final normalized simulation results.
3. Results
3.1. Validation of MCNP using experimental and simulation comparison of the portable XRF
The Monte Carlo simulations gave us comparisons between simulated spectra and experimental spectra, which can be seen normalized to the experimental spectrum in figure 2 below. The agreement for the overall spectrum comparison of the x-ray tube output was about what was expected. The normalization shown in this has no relation to dose matching, but is solely based on area to demonstrate the correct shape acquired by the simulation in this case. Figure 2 demonstrates some limitations in the simulation in reproducing the background at lower energies. The mismatch in the Compton scattering peak from the Ag target comes from the detector resolution, and inverse square effects, which are detailed in the discussion.
Figure 2.

Experimental versus simulation spectrum comparison for x-ray tube output from portable XRF.
3.2. High-energy x-ray tube target optimization
Uranium (U) was chosen as the target because of the energy of the characteristic x-rays as well as being explicitly cited as target materials in patents for high Z target x-ray tubes (Ehrke et al 1929, Parsons and Cheng 2013). A comparison of the energy of the characteristic x-rays from U after undergoing Compton scattering at various angles is seen in table 1. Table 2 shows the Pb characteristic x-ray energies.
Table 1.
Energy of uranium K-lines after Compton scatter through the specified angle.
| Uranium Angle | Scattered Energy (keV) | K-beta | |
|---|---|---|---|
|
| |||
| K-alpha1 | K-alpha2 | ||
| 75 | 86.2 | 83.4 | 94.0 |
| 90 | 82.6 | 80.0 | 89.8 |
| 105 | 79.3 | 76.9 | 85.9 |
| 120 | 76.5 | 74.2 | 82.6 |
| 135 | 74.2 | 72.1 | 79.9 |
| 150 | 72.5 | 70.5 | 78.0 |
| 165 | 71.5 | 69.5 | 76.8 |
| 180 | 71.1 | 69.2 | 76.4 |
|
| |||
| Relative intensities | 100 | 62 | 37 |
Table 2.
Pb characteristic x-ray emission energies.
| Pb | K-alpha1 | K-alpha2 | K-beta |
|---|---|---|---|
| Energy (keV) | 75.0 | 72.8 | 84.9 |
| Relative intensities | 100 | 62 | 35 |
From the comparison of this data, the target and detector source angle was chosen to not conflict with characteristic Pb x-rays. Thus, a 90° geometry using a Uranium target was chosen as the optimal setup for our simulation.
After identifying our target and geometry, we optimized the target thickness. The optimization was done by maximizing the x-rays with energy greater than the binding energy of Pb, which we deemed as potentially inducing Pb signal, and minimizing the radiation dose. This method incorporated a way to identify which x-rays created in the tube would ultimately be useful versus the x-rays just increasing our dose without further use. Since we are also using dose as a normalization factor, it is of the utmost importance that we minimize it in the optimization process.
In doing this optimization, it was most useful to create functions to define the results to get a more precise calculation for the optimized target thickness. Using a simulation for 5 varying target thicknesses we formed a function that would define the relationship over target thicknesses about equal to those already simulated.
Finally, these functions were compared as a ratio. We used a ratio since both dose and potential signal should linearly affect our final characteristic yield in our simulation. This ratio was then maximized to find the most potential signal versus the least radiation dose, and the optimal target thickness was found to be 0.56 mm. A visual representation of this is seen in figure 3 below. The final optimized spectrum with 0.56 mm target thickness is shown in figure 4.
Figure 3.

Potential x-ray signal divided by radiation dose versus Uranium target thickness in centimeters.
Figure 4.

Optimized spectrum obtained using the 0.56 mm Uranium target thickness.
3.3. High-energy x-ray tube geometry optimization
Using our uranium target with a 90° geometry, we wanted to determine which setup of three would be most optimal for the source detector geometry: (1) thinnest tissue at the x-ray tube source, (2) thinnest tissue halfway between source and detector, and (3) thinnest tissue at the detector. The comparison between these situations can be seen in table 3 as a percentage of the signal from the optimized geometry with the thinnest tissue at the detector. To further clarify this comparison figures 5(A) and (B) show examples of the geometry for thinnest tissue at the source and detector respectively.
Table 3.
Detector geometry optimization in terms of the thinnest tissue directiona.
| Source | Halfway | Detector |
|---|---|---|
| 0.326 | 0.644 | 1.000 |
Figure 5(A) represents the ‘Source’ geometry, figure 5(B) represents the ‘Detector’ geometry, and ‘Halfway’ is represented by the center of the bone at a midpoint between the source and detector. The numbers represent the Pb signal collected for each setup, which is then normalized to the maximal geometry of the bone closest to the detector (figure 5(B)).
Figure 5.

Example of geometry with thinnest tissue at the source (A) and thinnest tissue at the detector (B).
3.4. Comparison between the high-energy x-ray Tube KXRF and Cd-109 KXRF Bone pb measurements
The results from the simulation are shown in table 4 below. A sample spectrum as taken from the CdZnTe detector with 100 ppm phantom is shown below in figure 6. The simulation signals are normalized to the skin dose for Cd-109 based KXRF systems. The detection limit was calculated as done with previous XRF devices using net and background counts (Specht et al 2014) with the equation
Table 4.
Detection limit calculation (2 sigma) for different detector materials in simulated KXRF x-ray tube system.
| Si | CdZnTe | Ge | |
|---|---|---|---|
| Detection limit (μg g−1 bone mineral) | 82.14 | 6.91 | 4.09 |
Figure 6.

Sample spectrum as taken from the CdZnTe detector simulation for the 100 ppm phantom.
where
and BKG is the background counts under the Lα or Lβ peaks and Net100ppm is the net counts under the Lα or Lβ peak for the 100 ppm phantom. The channel range for background was chosen based on an estimated peak width given the resolution for the different detector materials of 0.5%, 3%, and 0.5% for Si, CdZnTe, and Ge respectively. For reference, modern KXRF measurement systems have a detection limit of about 3 μg g−1.
4. Discussion
The results from this study show that it is feasible to use an x-ray tube based KXRF system to measure bone Pb. Although there would be many obstacles to overcome in comparison to the Cd-109 based system by using a different geometry causing potential signal degradation, using a different material detector with lesser detector resolution, and using a source that has non-optimal properties for exciting Pb energies in materials. Even considering these initial problems, the system would still be viable for measurement with a detection limit only slightly greater than current modern Cd-109 based systems, but with many potential advantages in portability and avoiding source licensing. The system would also have advantages over current portable XRF technology because it would not have the issues with skin thickness that degrade the measurement significantly for some individuals (Specht et al 2014, 2016). Our study also shows the validity of using MCNP for x-ray tube and XRF simulations through comparison with experimental work.
MCNP simulations showed good agreement with experimental results from our Ag target x-ray tube based system. The simulation matched the shape of the experimental spectrum well, demonstrating its ability to accurately determine electron interactions in the target and filters through attenuation and absorption; however, one thing the simulation lacked was an appropriate amount of background in the low energy areas of the spectrum. Since our simulation for the high-energy x-ray tube excluded the energies with these background issues, this was not an issue for our determination of feasibility for the high-energy x-ray tube. The Ag characteristic peaks mismatched visually, but after corrections proved to be in good agreement. Visually the peak differences were mostly a result of detector resolution and channel separation with the Compton scattering peak usually encompassing multiple energy bins and having increased width from detector properties. Numerically, this was because of the way the experimental spectrum was measured. Since characteristic production is isotropic and bremsstrahlung production is mostly in the forward direction in our transmission x-ray tube, there will be a dependence on distance from the target in the x-ray tube for characteristic production. Thus, being 10 cm away from the x-ray tube for our measurement of the spectra impacted the resultant comparison between the characteristic yield in the target versus the bremsstrahlung production, which would be mostly in the forward direction. When correcting the spectrum this way, the percent error between the Ag characteristics peaks for simulation and experiment goes to 0.4%.
The target thickness was optimized using the potential signal production, which just summed the counts for x-rays produced above the binding energy of Pb, and radiation dose. By using potential signal production rather than actual signal production, we were able to avoid potential differences between the two simulations. The first simulation of x-ray production has a slightly different source definition than the second simulation, which used a slightly more conservative source definition. If we were to use actual signal production as our optimization factor we would be using both simulations, but by using only the potential signal production for optimization we only used the initial x-ray tube simulation. This approach helped to minimize any potential differences between the simulations.
The choice of geometry is different from traditional Cd-109 systems with a 180° geometry. A 180° geometry has both the source and detector centered on the tibia bone with least amount of soft tissue interference. The 90° geometry was chosen to reduce any interference with Compton scattering from the uranium target. Uranium characteristic energies from the uranium target scattered at 180° would be the same energy of the K-alpha characteristic energies of Pb, so these two different peaks would likely be indistinguishable. The uranium characteristic energies scattered at 90° are at least 5 keV higher than Pb K-alpha energies. The K-alpha Pb peaks will be the main source of signal for determining Pb concentration. Peaks from scatter will surround the K-beta energy peak, but the K-beta peak only has 35% intensity and will contribute much less to overall signal than the alpha peaks.
Optimizing the in vivo measurement for 90° geometry is less straightforward than for the 180° geometry on the Cd-109 system. There are three different geometries we tested using the simulation. Each setup pointed the shin, or the portion of the leg with least soft tissue over the tibia bone, in different directions: at the x-ray tube source, 45° between source and detector, and at the detector. This comparison determined the maximum signal to arise from the geometry pointing the thinnest tissue section towards the detector. Although the simulated geometry used a crude ellipsoid for the skin thickness and a less accurate cylinder for the tibia bone, this is likely a true observation. By aligning the thinnest tissue thickness with the detector, the most Pb signals will be collected. When the x-ray tube irradiates the leg, the energy of the beam is high enough to penetrate through the surfaces and successfully ionize elements in the bone to create the initial Pb signal. That creation of signal would then serve as a secondary isotropic source in the bone of the leg, which would by definition of the inverse square law, have most signal collection by placing the detector closest to the bone where the source is located. Thus, the optimized geometry with the thinnest tissue at the detector is justified.
The 90° geometry should work in our favor in terms of background levels. Background, which will primarily come from a photon undergoing multiple Compton scattering interactions, should be minimized with a 90° geometry. Although, other scattering angles will each contribute small amounts to the background, looking at the Klein–Nishina formula reveals that the majority of scattering will be in the forward direction of the x-ray tube. Since 90° Compton scatter interactions at the energies of our x-ray tube would have the lowest cross-section of any angle, the background would be minimized with this geometry. This will help lower the detection limit of the device, especially since our analysis assumes equivalent background between the Cd-109 system and our high-energy x-ray tube system. When moving towards experimental designs, the isolation of a consistent geometry will be the utmost concern for this system.
The detection limit calculation is done as prior systems similarly to how prior systems have been tested (Specht et al 2014). These detection limit estimates give us insight into the difference the detector materials will make in our proposed system, and demonstrate the feasibility of the system itself for bone Pb measurement. It is also important to keep in mind the detectors may differ in size from the estimates used for the simulation, and these simulations did not take into account detector dead time, which will be another area where signal loss will occur. Overall an experimental comparison will likely vary from the results shown here, which demonstrate a conservative estimate for the detection limit, but the results should be consistent in verifying the feasibility of the system.
Although simulations leave out certain challenges the experimental setup will face, we believe these results demonstrate the feasibility of a KXRF x-ray tube system based on the detection limit estimates. There are numerous advantages of a KXRF system that is much more portable without the hindrance of liquid nitrogen cooling, using an x-ray tube source without degradation or complicated licensing, and using k-shell energies to reduce the effect of soft tissue.
5. Conclusions
MCNP has been shown to be a validated method in properly simulating x-ray tube physics by producing spectra of the same quality as experimental x-ray tubes of the same design. A high-energy x-ray tube based KXRF system using a transmission target made of uranium, has the ability to measure Pb in bone samples with a detection limit similar to second-generation radioisotope based KXRF bone Pb measurement systems. By using the high-energy of KXRF we can avoid the substantial limitations of soft tissue thickness that are prevalent in the portable XRF, but still maintain relative portability with an x-ray tube source. Based on these findings, development of a portable x-ray tube based KXRF system is feasible for in vivo measurement of bone Pb.
Acknowledgments
The authors declare that there are no conflicts of interest regarding the publication of this paper. This work was supported by the Purdue University Nuclear Regulatory Commission (NRC) Faculty Development Grant NRC-HQ-11-G-38-0006, the National Institute for Occupational Safety and Health (NIOSH) R21 grant 1R21OH010044, and Purdue Ross Fellowship.
References
- Chettle DR, Scott MC, Somervaille LJ. Lead in bone: sampling and quantitation using K x-rays excited by 109Cd. Environ Health Perspect. 1991;91:49–55. doi: 10.1289/ehp.919149. [DOI] [PMC free article] [PubMed] [Google Scholar]
- Ehrke LF, Tridle UC, Wesley MJ. Composite x-ray target. 1733744 A Google Patents US Patent. 1929
- ICRP. Basic anatomical and physiological data for use in radiological protection—the skeleton ICRP Publication 70. Ann ICRP. 1995;25:25–30. [PubMed] [Google Scholar]
- Nie H, et al. In vivo investigation of a new 109Cd gamma-ray induced K-XRF bone lead measurement system. Phys Med Biol. 2006;51:351–60. doi: 10.1088/0031-9155/51/2/011. [DOI] [PubMed] [Google Scholar]
- Parsons BB, Cheng CC. Transmission type x-ray tube and reflection type x-ray tube. US20130108024 A1 US Patent. 2013
- Pejović-Milić A, et al. Ultrasound measurements of overlying soft tissue thickness at four skeletal sites suitable for in vivo x-ray fluorescence. Med Phys. 2002;29:2687–91. doi: 10.1118/1.1513569. [DOI] [PubMed] [Google Scholar]
- Salgado CM, Conti CC, Becker PH. Determination of HPGe detector response using MCNP5 for 20–150 keV x-rays. Appl Radiat Isot. 2006;64:700–5. doi: 10.1016/j.apradiso.2005.12.011. [DOI] [PubMed] [Google Scholar]
- Specht AJ, et al. XRF-measured bone lead (Pb) as a biomarker for Pb exposure and toxicity among children diagnosed with Pb poisoning. Biomarkers. 2016;2016:1–6. doi: 10.3109/1354750X.2016.1139183. [DOI] [PMC free article] [PubMed] [Google Scholar]
- Specht AJ, Weisskopf M, Nie LH. Portable XRF technology to quantify Pb in bone in vivo. J Biomark. 2014;2014:398032. doi: 10.1155/2014/398032. [DOI] [PMC free article] [PubMed] [Google Scholar]