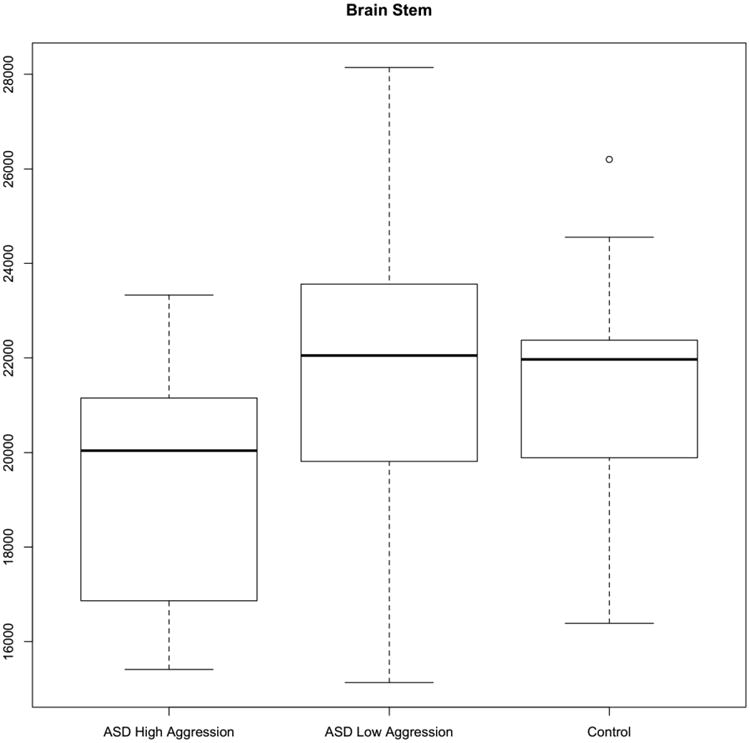
Figure 1.

Brainstem volume (in mm3) by group. The boxes represent the median and the first and third quartiles for each group. The whiskers represent the minimum and maximum of all data in each group. The low aggression ASD group is more similar to the control group on brainstem volume.
