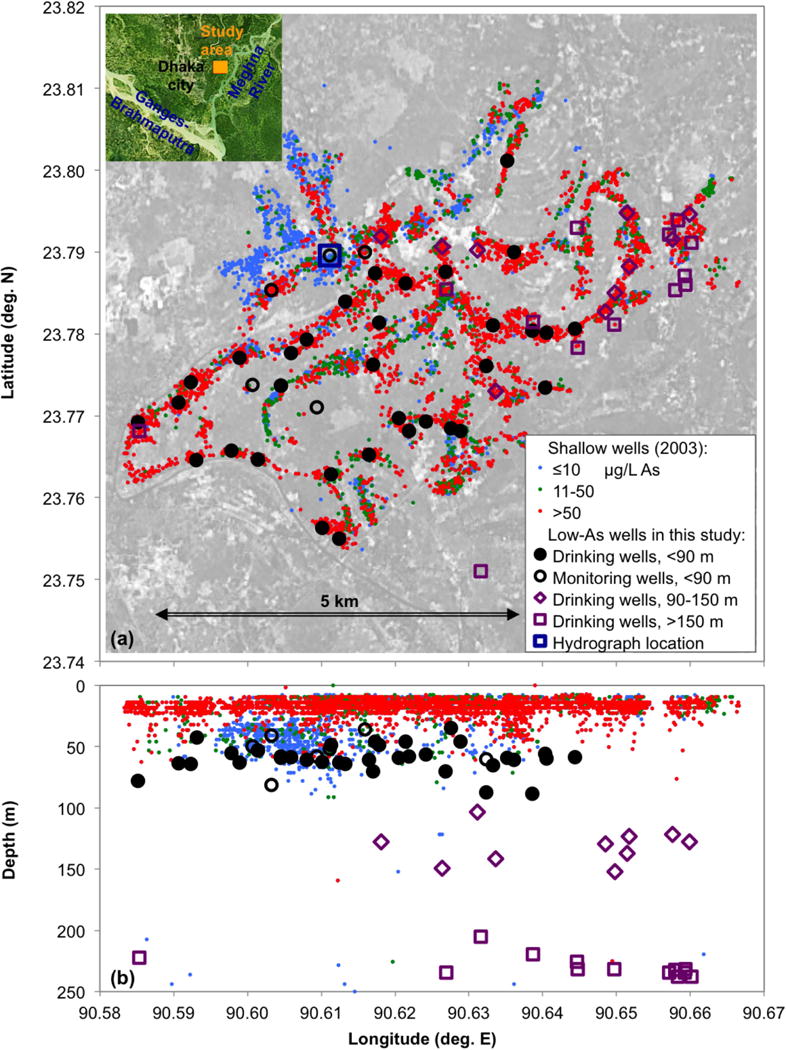
Figure 1.

(a) Map of the field area in Araihazar upazilla, Bangladesh, and (b) depth distribution of the wells. The low-arsenic wells discussed in this work are marked by large circles, diamonds, and squares. In this figure, and hereafter, the data are plotted as black circles for low-As groundwater from shallow depth (<90 m bgl), open purple diamonds for intermediate aquifer (90–150 m bgl), and open purple squares for deep groundwater (>150 m bgl). In this figure only, the distinction is also made between drinking (filled circles) and monitoring wells (open circles) installed within the shallow low-As aquifer; in subsequent figures, all shallow samples are rendered as filled black circles. The small circles in the background show the distribution of surveyed private, mostly shallow tubewells [van Geen et al., 2003] and are color-coded for As concentrations. The orientation of Araihazar field area (red square) with respect to Dhaka, Bangladesh and the major rivers is indicated by the inset in map (a).
