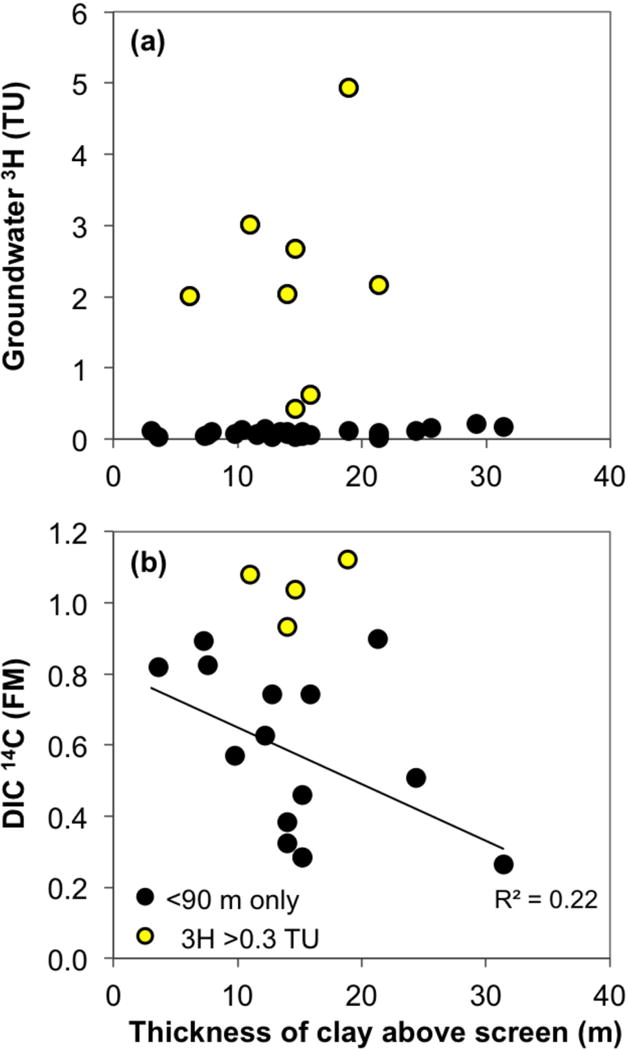
Figure 10.

The relationship between groundwater (a) 3H and (b) 14C vs. the total thickness of clay in lithologs of the shallow low-As wells. For samples where multiple measurements were made, the latest non-negative values of 3H are shown in (a) and the 14C values from 2010 are displayed in (b). The high 3H samples (>0.3 TU, yellow fill) were excluded from the 14C trendline with clay thickness shown in (b).
