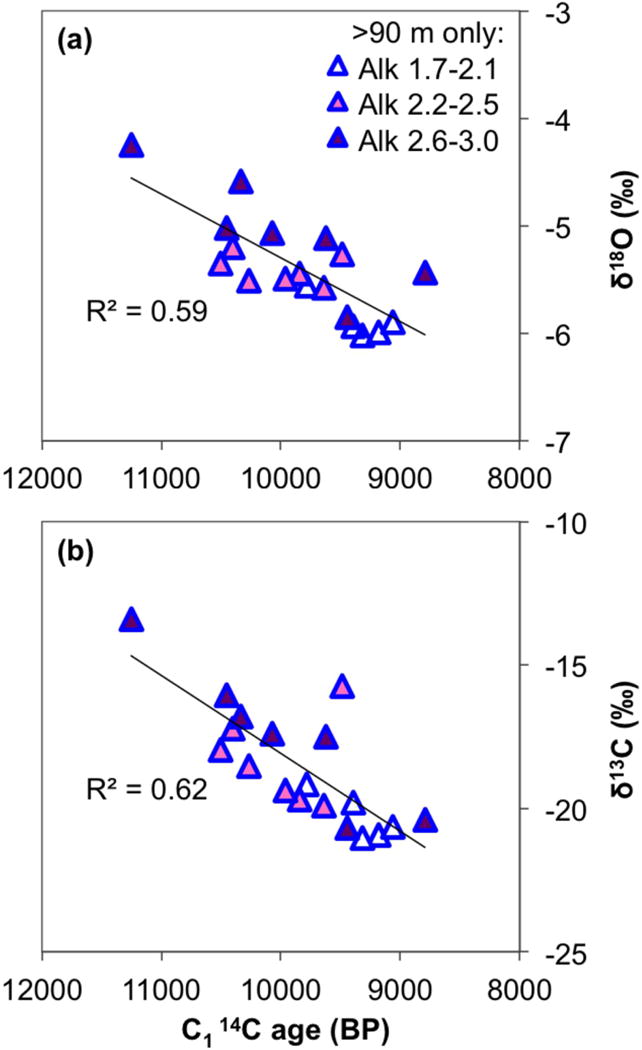
Figure 11.

Plots of (a) δ18O and (b) δ13CDIC against the C1 14C age in intermediate and deep groundwater only (samples from >90 m bgl), with an added third dimension of alkalinity. The units of alkalinity concentrations shown in the legend are mEq/L, and the three concentration ranges were selected based on the spread of data values. The overall trendlines for pooled intermediate and deep samples and their R2 values are displayed.
