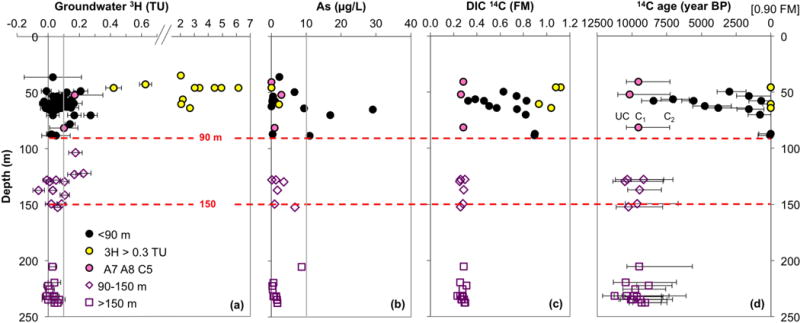
Figure 3.

Profiles of groundwater (a) 3H with analytical error, (b) dissolved As, (c) 14C in DIC, and (d) 14C ages plotted against sample depth. All 3H measurements, including several repeat measurements, are shown; for samples where 14C was measured twice, 14CDIC and calculated ages plotted in this figure, and hereafter, are based on the 14C values obtained in 2010. The grey line in (a) indicates 0.1 TU, the concentration above which all 3H samples (except for two with a large analytical error) are conclusively detectable, whereas the grey line in (b) denotes the current World Health Organization limit of 10 μg/L As in safe drinking water. The symbols in (d) show C1 14C age, a simple open system model that corrects for the initial 14CDIC at recharge of 0.90 FM. The error bars indicate “UC” (uncorrected) 14C age as the maximum age, calculated directly from the measured 14C values without any correction, and C2 14C age as the minimum age, which contains an additional correction for the maximum contribution of radiocarbon-dead carbonate dissolution along the flowpath. In this figure, and hereafter, the pink fill in black circles indicates the shallow depth samples (A7, A8, and C5) with consistent deeper groundwater properties across various geochemical and age parameters, whereas the yellow fill in black circles denotes shallow aquifer groundwater with particularly elevated 3H concentrations (>0.3 TU).
