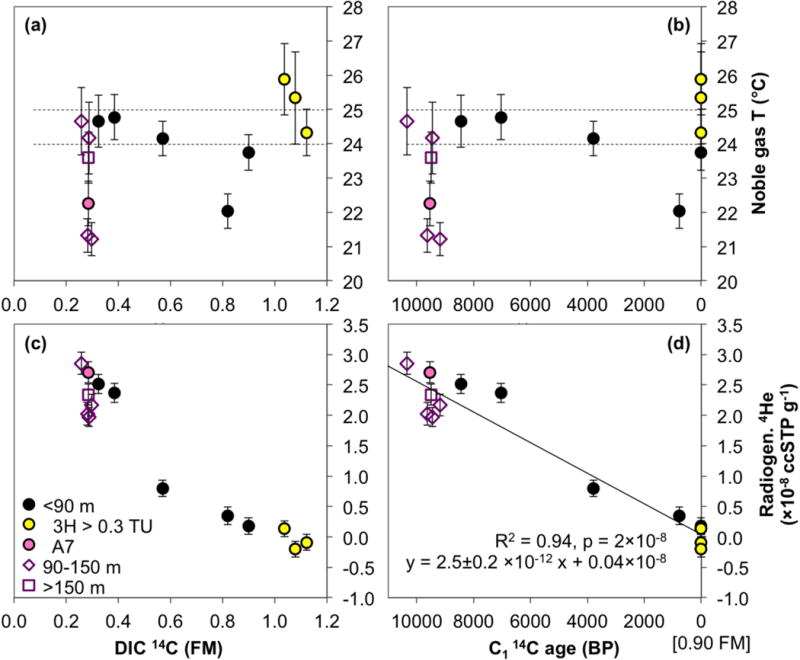
Figure 5.

Noble gas temperatures and radiogenic (“excess”) He plotted against 14C measured in DIC (a and c), and corrected C1 14C ages (b and d). Noble gas temperatures, corresponding to temperatures at the time of recharge, and radiogenic He were estimated by Taf-1 model fit to the measured noble gas data. Only the samples where model converged are plotted. The errors indicated by vertical error bars combine the analytical error with model fit uncertainty. Only one sample per well is shown; where multiple noble gas measurements were made, those with the best noble gas model fit are displayed. Dashed lines in (a) and (b) mark the 95% confidence interval of the average noble gas temperatures of shallow samples, excluding the two outliers at approximately 22 °C. The trend linking radiogenic He to C1 14C ages was calculated for combined shallow, intermediate, and deep groundwater samples.
