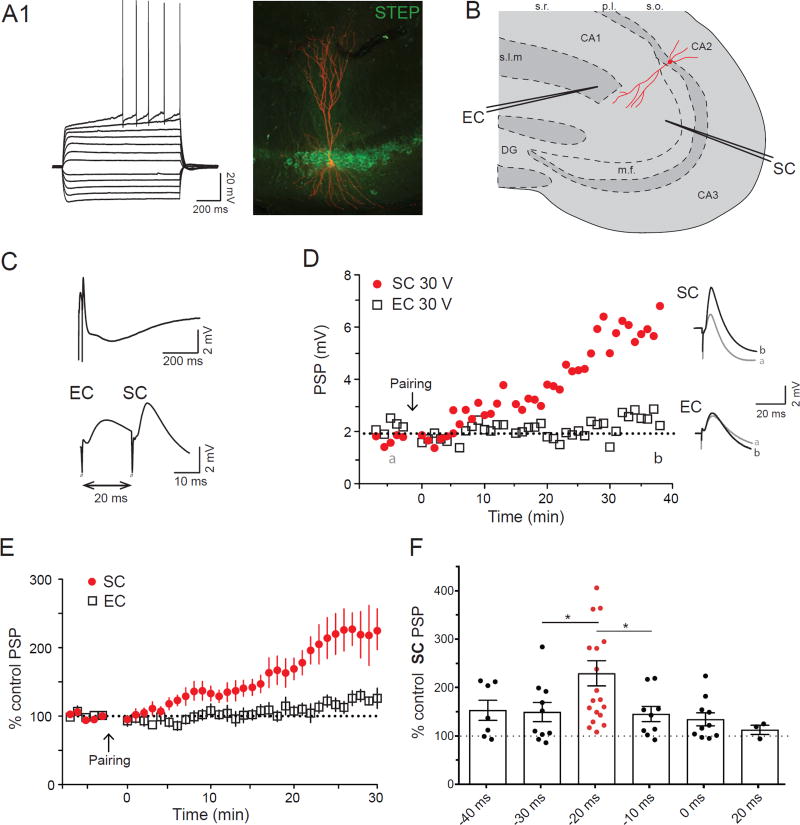
Figure 1. CA2 PNs display ITDP.
A1. Whole-cell current-clamp recording following injection of 25 pA current steps. A2. Streptavidin (red) and STEP (green) immunohistochemistry of the biocytin filled PN. B. Drawing of the localization of the stimulating electrodes in the hippocampal slice. C. Current-clamp response during the ITDP induction protocol (repeated 90 times at 1 Hz). The bottom trace is an enlargement of the upper one. D. Time course of the EC and SC PSPs amplitudes obtained in current-clamp following ITDP induction (left). On the right are displayed the SC and EC PSP before (grey) and after (black) ITDP. Data from A to C (and from Supplementary figure 1S1) is from the same CA2 PN. E. Time course of the average normalized PSPs amplitudes obtained in whole-cell current-clamp following ITDP induction. F. Normalized SC PSP amplitudes following ITDP induction using different intervals between the EC and SC stimulation (−20ms indicate EC followed by the SC 20ms later). Data are represented as mean ± SEM. See also Figure S1.

