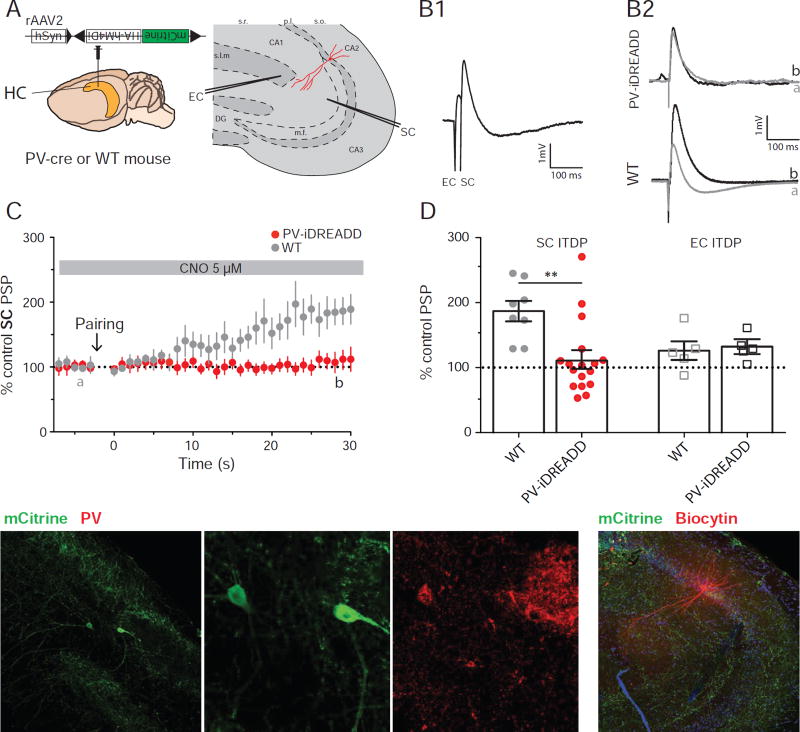
Figure 3. PV+ IN population is necessary for ITDP expression.
A. Experimental design showing injection of Cre-dependent iDREADD virus in PV-Cre or WT mouse. B: PSPs recorded in whole-cell current-clamp configuration in response to paired electrical stimulation of EC+SC inputs (B1) or SC inputs alone (B2) from neurons in slices from PV-Cre mouse expressing iDREADD or WT mouse injected with same virus (no iDREADD expression). B1. Example paired EC+SC PSPs from neuron in iDREAD-Dexpressing slice. B2. SC-evoked PSPs before (black) and 30 min after (grey) ITDP induction. C. Time course of mean ± SEM SC PSP amplitude during ITDP. D: SC (filled circles) and EC (open squares) PSP amplitude following ITDP induction using electrical pairing in WT or PV-Cre mice, both injected with iDREADD. Symbols show data for single cells; bars show mean ± SEM. E. Immunohistochemistry of acute hippocampal slice showing mCitrine (from Cre-dependent virus) and PV expression. F. Immunohistochemistry of acute hippocampal slice showing mCitrine and biocytin-filled neuron. See also Figures S3 and S4.

