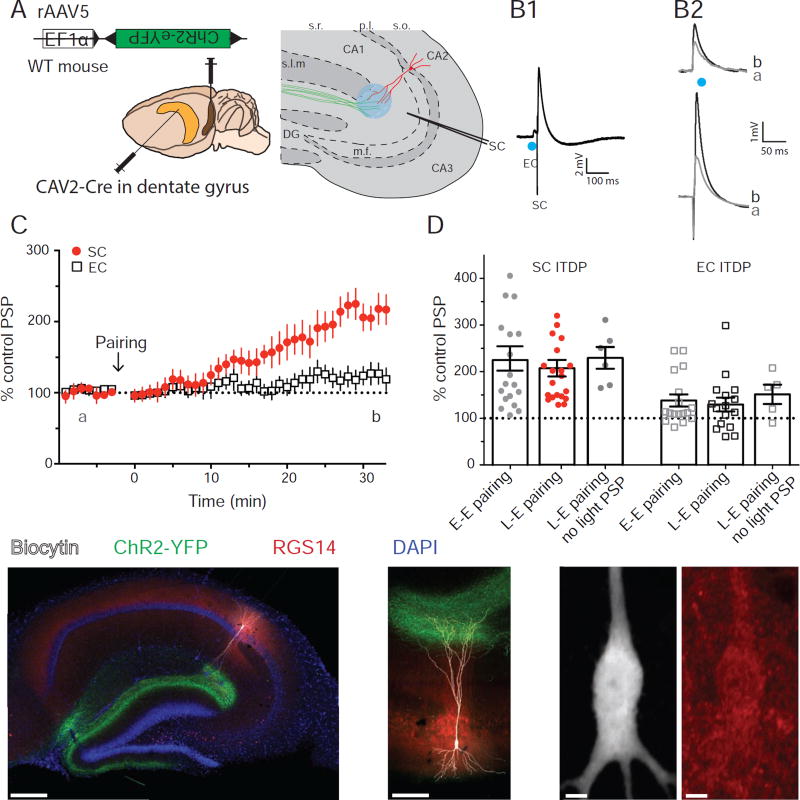
Figure 6. Pairing photo-stimulation of LEC LII stellate cells inputs with SC electrical stimulation induces ITDP in CA2.
A. Experimental design and injection sites of CAV2-Cre in DG and Cre-dependent ChR2 rAAV in EC. B. CA2 PN PSPs from whole-cell current-clamp recordings. (B1) PSPs evoked using paired light (EC) and electrical (SC) stimulation during ITDP induction. (B2) Light-evoked EC PSPs (top) and electrically evoked SC PSPs before (black) and 30 min after (grey) ITDP induction. C. Time course of mean ± SEM peak PSP amplitude during ITDP. D. SC (filled circles) and EC (open squares) PSP amplitudes normalized by baseline showing ITDP induced by pairing electrical stimulation of the SC input with electrical (E-E) or light (L-E) stimulation of the EC input. Results for ITDP in cells that showed no light-evoked EC PSP are also shown (L-E pairing, no light PSP). Symbols show data for single cells; bars show mean ± SEM. E. Immunohistochemistry from hippocampal slices against YFP, Biocytin and RGS14. E1. Whole slice. E2. Expanded view of the recorded cell morphology. E3. High magnification view of the soma of the recorded cell (left, biocytin image) to confirm the expression of the CA2 marker RGS14 (right, red). See also Figure S7.

