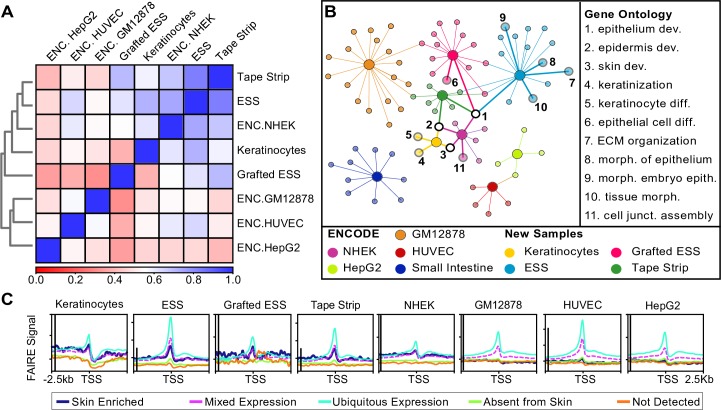
Fig 2. Global functional analysis of FAIRE signal and peaks.
(A) Correlation matrix of FAIRE signal profiles in keratinocytes, ESS, Grafted ESS, Tape-stripped graft, and ENCODE NHEK, HUVEC, HepG2, and GM12878, using deepTools multiBigwigSummary. Blue represents perfect overlap, red indicates no correlation (see key). (B) ToppCluster analysis of the genes annotated to each FAIRE peak in Keratinocytes (yellow), ESS (light blue), Grafted ESS (pink), Tape-stripped ESS (dark green) and ENCODE NHEK (purple), HepG2 (light green), Small Intestine (dark blue), HUVEC (red), and GM12878 (orange) samples. Genes present in all samples were filtered out prior to analysis. Large circles represent an input sample and smaller circles represent GO terms. GO terms related to epidermal development are numbered and identified. (C) FAIRE signal within +/- 2.5kb of the transcription start site (TSS) of Human Protein Atlas lists of genes elevated in skin (dark blue), with mixed expression patterns that include skin (pink), expressed in all tissues (light blue), not expressed in skin (green), and not detected in any tissue type (orange). The y-axis scales on the ESS, Tape-strip, and HUVEC graphs were adjusted to better display the data. The black line to the right of the axis represents 3 arbitrary units of data coverage in each graph. Abbreviations: ENC- ENCODE; dev.- development; diff.- differentiation; ECM- extracellular matrix; morph.- morphogenesis; junct.-junction; epith.- epithelium.

