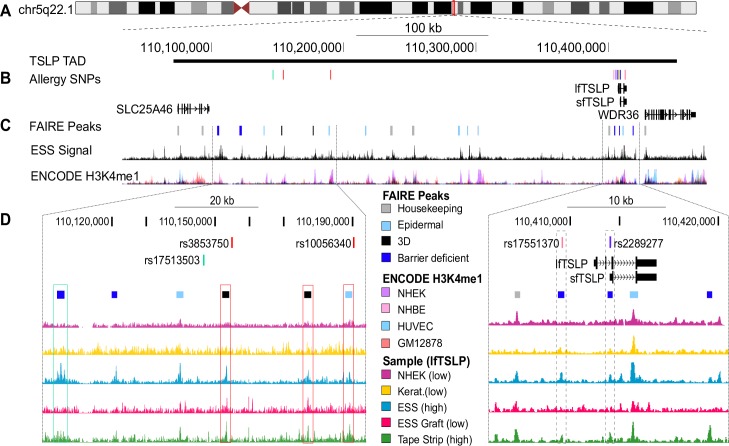
Fig 5. Dynamic FAIRE peaks in the TSLP transcriptionally associated domain (TAD) associate with allergic disease-associated SNPs.
(A) The most likely TSLP regulatory region was identified using published Hi-C data from several cell types to infer the TAD around TSLP [39]. (B) GWAS SNPs located within the TSLP TAD (n = 16); all are associated with allergic disease (see Table 1 and Methods). (C) FAIRE peaks within the TSLP TAD designated by category: Housekeeping peaks which were present in our samples as well as in at least 3 ENCODE FAIRE cell types (grey); epidermal peaks, present in our samples but not in non-epidermal ENCODE cell types (light blue); Three-dimensional (3D) peaks present only in stratified epidermis (black); and Barrier-deficient peaks that were present in the context of insufficient epidermal barrier (ESS and Tape-strip) but absent in an intact barrier (Graft) or culture monolayer (keratinocytes, NHEK; dark blue). Representative ESS signal is shown below, along with ENCODE H3K4me1. Color designations for the most prominent cell types in the H3K4me1 track are indicated in the legend. (D) FAIRE signals from ENCODE NHEK, cultured Keratinocytes, ESS, Grafted ESS, and Tape-stripped ESS are shown for the TSLP locus (right panel) as well as a distal region ~200-250kb upstream of TSLP (left panel) containing allergy-associated SNPs and dynamic peaks. Two Barrier-deficient peaks (dashed boxed regions, right panel) overlap rs17551370 and rs2278277, respectively. Rs17551370 is associated with allergic rhinitis [42] and rs2289277 is a known expression quantitative trait locus (eQTL) [43] for TSLP and associated with changes in IgE levels [44, 45]. Four distal (left panel) Epidermal, 3D, and Barrier-deficient FAIRE peaks are in high (R2 = 0.8–1) linkage disequilibrium (LD) with allergy-associated SNPs. Peaks are boxed in the same color as the SNP they are in LD with. Full LD plots and analysis are in S4 Fig and Table 1.

