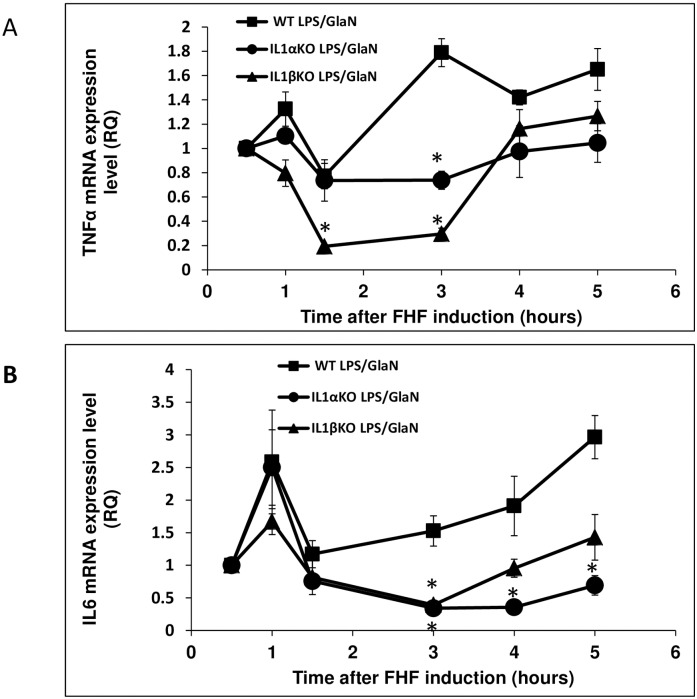
Fig 6. Hepatic TNF-α and IL-6 expression in WT, IL-1α and IL-1β mice levels after LPS/GalN injection.
WT, IL-1α and IL-1β KO mice were injected with LPS/GalN at time point 0. Mice were sacrificed at the indicated time points and RNA was purified from their livers. Hepatic TNF-α (A) and IL-6 (B) expression levels were evaluated using qRT-PCR (n = 3 in each group at each time point). Results are expressed as mean ± standard error. Differences between groups were assessed using the analysis of variance (T-TEST). Significant differences between the analyzed groups (IL-1α and IL-1β) and the control group (WT) are marked by * and represent Pv<0.05.

