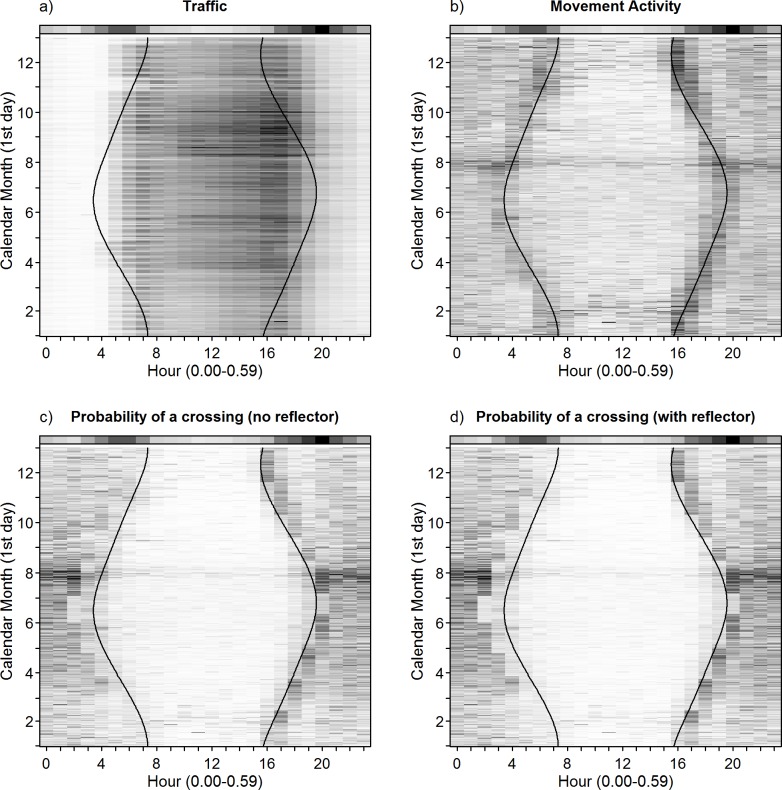
Fig 5.
Temporal variation (daily and annual) in a) mean traffic volume (range: 1–355 vehicles/h), b) mean movement activity of the animals (range: 3–550 m/h) and the probability of a road crossing to occur as predicted by the model in c) the presence and d) absence of wildlife warning reflectors. Darker values indicate increasingly high values and vice versa. Note that traffic and movement activity were averaged across all studied animals in this figure. The colour bar at the top of each panel denotes the diurnal pattern of roe deer vehicle collisions reported by Steiner et al. [7] and four references therein (as percent DVC occurrence for each hour of the day). The black lines indicate the variation in the time of sunrise and sunset throughout the year.

