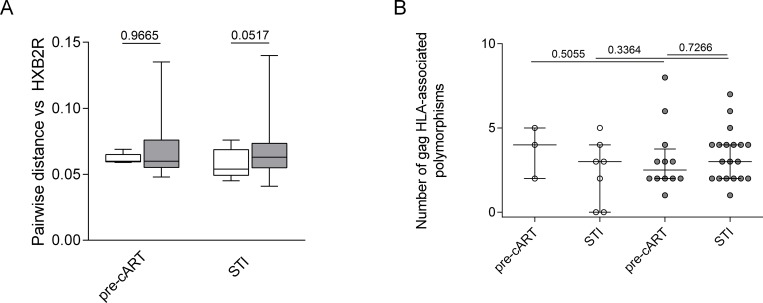
Fig 4. No evidence of immune selection pressure in rebounding virus after therapeutic MVA-B vaccination.
(A) Pairwise distances to the reference sequence HXB2 is shown for samples obtained before ART initiation and after 2–12 weeks of treatment interruption. P-value for Mann Whitney test between defined groups (placebo and vaccinated) is shown. (B) The number of HLA-associated polymorphisms in Gag is shown for sequences obtained before cART (n = 3 placebo, n = 12 vaccines) and during viral rebound after STI (n = 7 placebo, n = 19 vaccines). P-value is shown for Wilcoxon paired test when comparing between pre-cART and STI data and p-value for Mann Whitney test is shown to compare groups.

