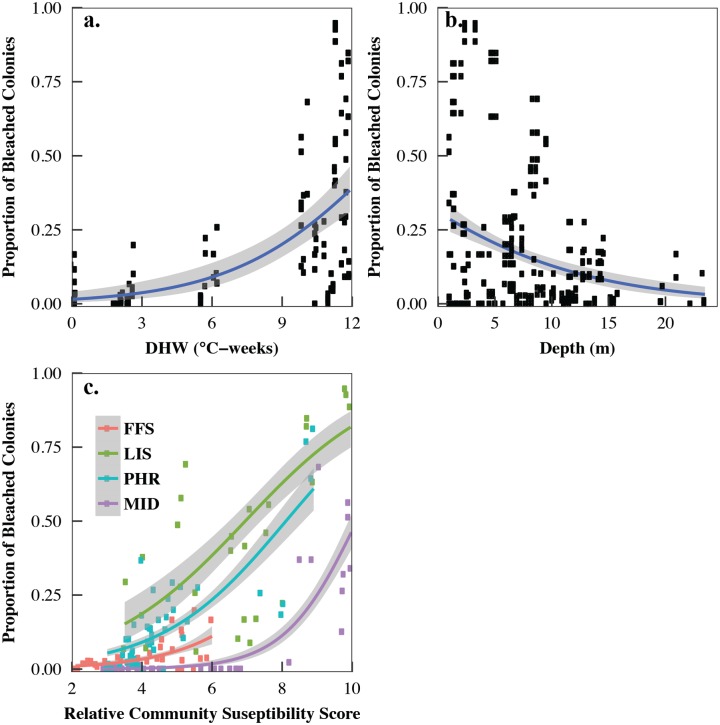
Fig 6. Generalized regressions of relationship between the proportion of bleached colonies and (a) CRW’s 5 km Degree Heating Week (DHW) during survey, (b) depth, and (c) the interaction of region and relative community susceptibility.
Solid line: predicted bleaching (with binomial errors). Grey area: upper and lower 95% confidence intervals.

