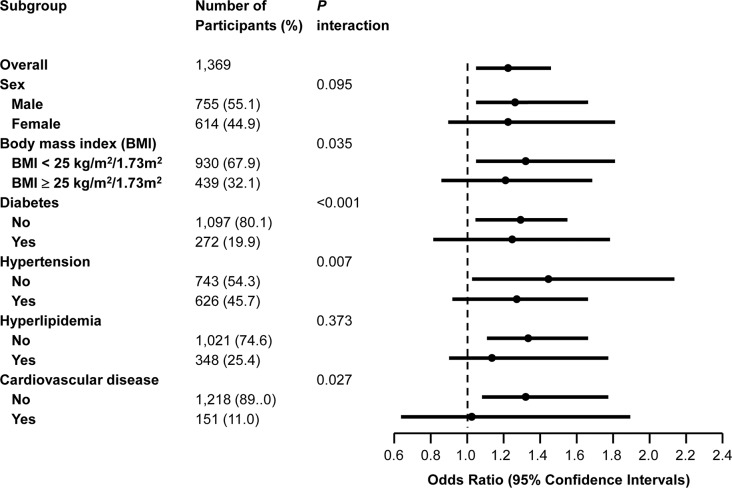
Fig 1. Forest plot of dietary estimated net endogenous acid production (eNEAP) and chronic kidney disease in overall participants and subgroups.
Odds ratios (95% confidence intervals) were per quartile of eNEAP. Odds ratios were adjusted for age, sex, total caloric intake, dietary sodium intake, body mass index, smoking, education state, health-enhancing physical activity, hypertension, diabetes, hyperlipidemia, and cardiovascular disease (Model 2).

