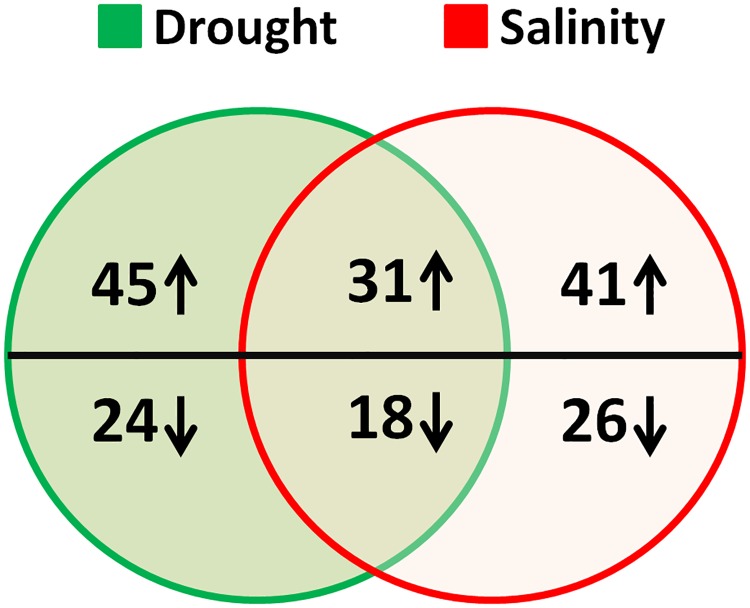
Fig 6. Venn diagram indicating the distribution of modulated proteins under drought and salinity.
Each circle is corresponding to the number of identified proteins in response to individual stress. The number of common proteins represented by overlap region. The numbers of up-regulated and down-regulated proteins are represented by the arrow above and below horizontal line, respectively.

