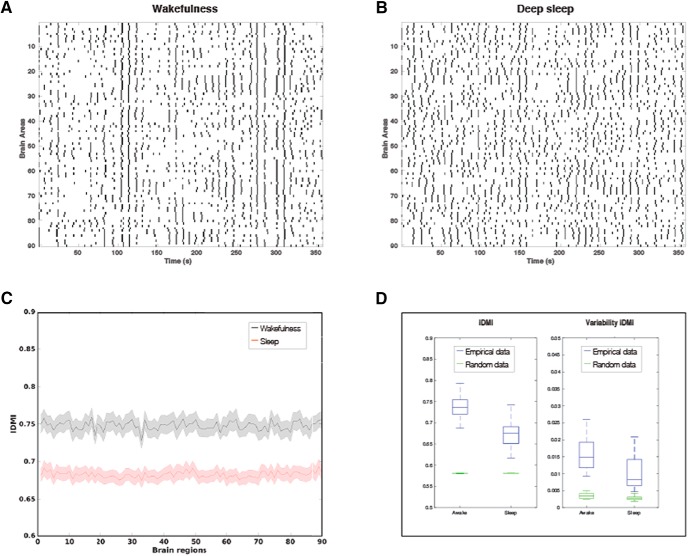
Figure 2.
The Ignition-Driven Mean Integration (IDMI) for wakefulness and deep sleep. A, Example of intrinsic ignition events for a time window in one wakeful participant. B, Example of intrinsic ignition events for a participant in deep sleep across all brain regions. C, We plot the IDMI in wakefulness (top curve) and deep sleep (bottom curve) for all of the 90 AAL brain regions across all participants. They are clearly separated. D, Box plot shows that the IDMI across participants are significantly different between wakefulness and sleep in terms of both mean (left blue graphs, IDMI) and variability (right blue graphs, variability of IDMI) across brain regions. In addition, we show that computing IDMI on surrogate (in green), reshuffled data are significantly lower, showing the specificity of this novel measure.

