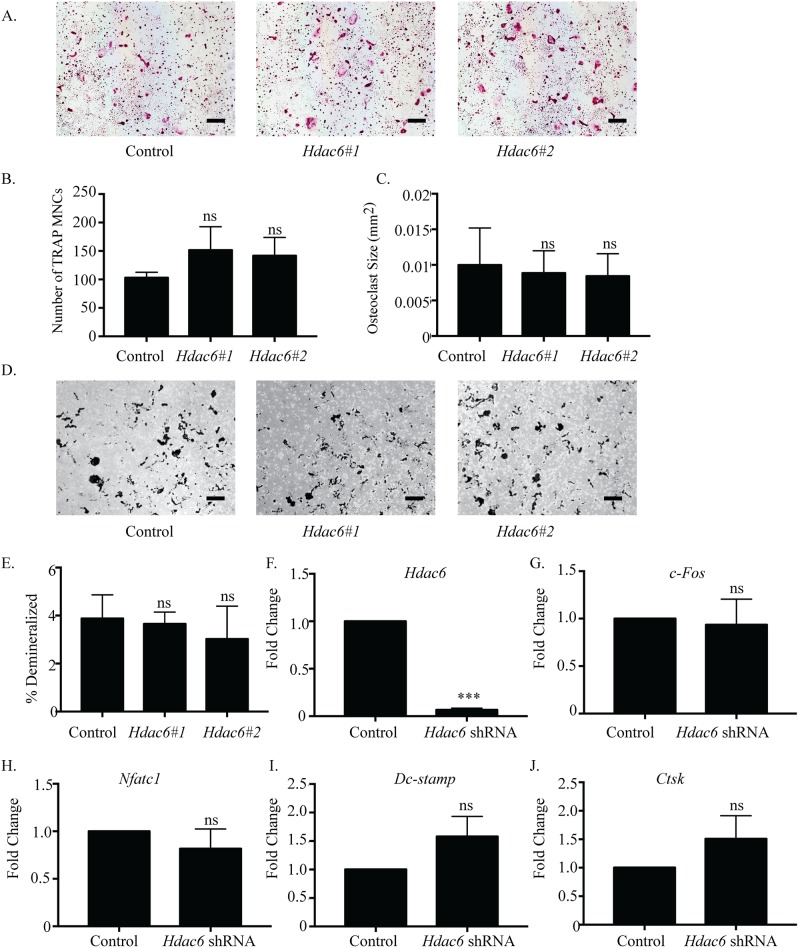
Fig 4. Hdac6 suppression does not affect osteoclast differentiation.
Representative images of TRAP staining (A) of osteoclast cultures. Hdac6#1 represents Hdac6 shRNA #1and Hdac6#2 represents Hdac6 shRNA #2. Quantification of (B) number and (C) size of TRAP-positive MNCs. Representative photographs (D) and quantification (E) of demineralization activity of control and Hdac6 shRNA-expressing osteoclast cultures grown on calcium phosphate-coated plates. Scale bar represents 200 μm. qRT-PCR (F) of control and Hdac6 shRNA-expressing cells. Expression profile (G-J) of c-Fos, Nfatc1, Dc-stamp, and Ctsk. Data presented are the mean of three independent experiments. *** p < 0.001; ns = not significant compared to control infected cells.

