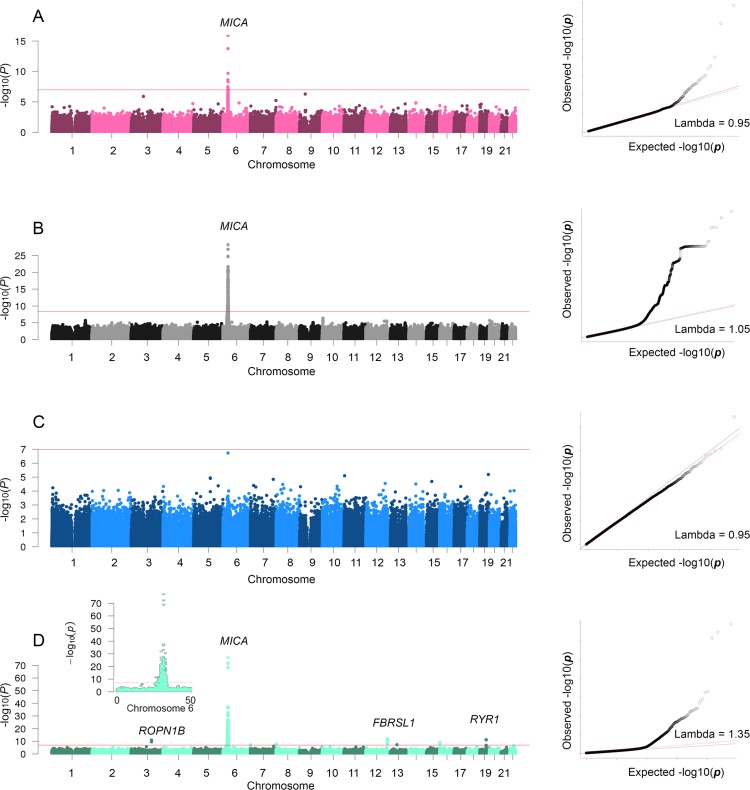
Fig 1. Manhattan and QQ plots for MIC-A.
The red line in the Manhattan plots (left panel) indicates the threshold of significance (Bonferroni adjusted P-value = 0.05). The black line in the QQ plots (right panel) shows the 1:1 regression line and the red line in the QQ plots is the regression line illustrating the inflation of low P-values and the slope of the red line equals the inflation factor (Lambda). A) Results from the primary EWAS between MIC-A and DNA methylation. B) Results from the primary GWAS. C) Results from the EWAS adjusted for all independent SNPs (N = 3) identified in the GWAS. D) Association between MIC-A GS and DNA methylation levels across the genome, and a zoom-in on a region of chromosome 6.

