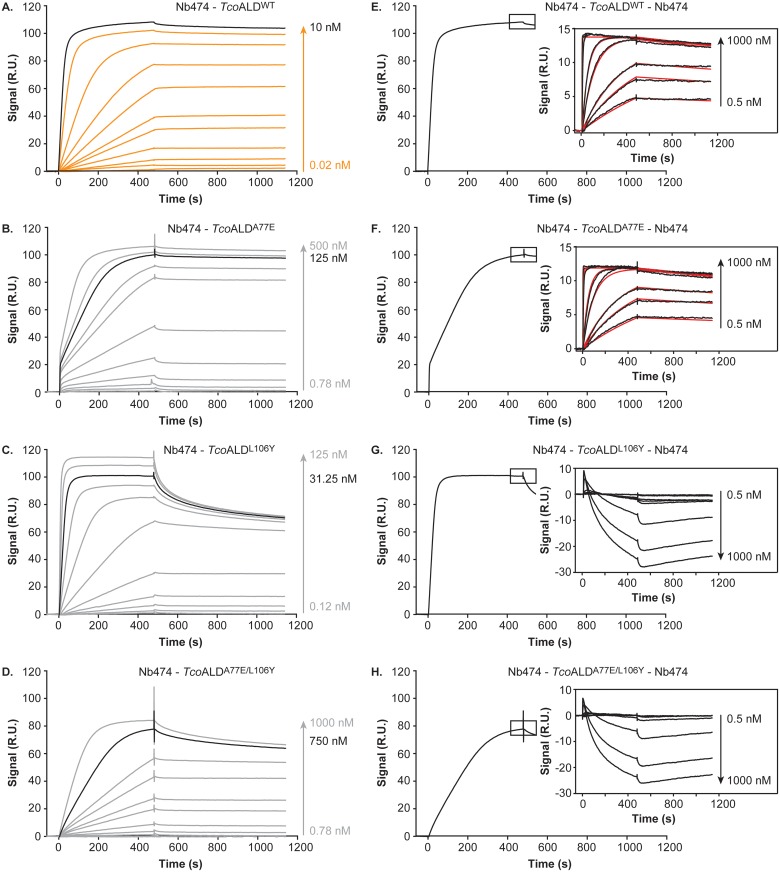
Fig 5. Investigation of the interaction between Nb474 and the TcoALD variants by SPR.
(A.-D.) SPR data recorded for the Nb474-TcoALDWT (A.), Nb474-TcoALDA77E (B.), Nb474-TcoALDL106Y (C.), and Nb474-TcoALDA77E/L106Y (D.) interactions with Nb474 as ligand and the TcoALD variants as analytes. For TcoALDWT the sensorgrams are shown in orange, while the experimental traces are displayed in grey for the TcoALD mutants. In all panels, the sensorgram in black indicates the concentration of analyte used to saturate the Nb474-coated sensor chip for the SPR sandwich assay. (E.-H.) Results of the SPR sandwich assay for the Nb474-TcoALDWT-Nb474 (E.), Nb474-TcoALDA77E-Nb474 (F.), Nb474-TcoALDL106Y-Nb474 (G.), and Nb474-TcoALDA77E/L106Y-Nb474 (H.) interactions with Nb474 as ligand and the TcoALD variants as analytes. Upon saturation of the Nb474-coated sensor surface with analyte (saturation obtained after ~500 s and indicated by the black rectangle), varying concentrations of Nb474 are injected onto the sensor chip surface. In all panels, the resulting sensorgrams (black traces) are shown in the insets. For the Nb474-TcoALDWT-Nb474 (E.) and Nb474-TcoALDA77E-Nb474 (F.) sandwiches the additional binding of Nb474 was fitted with a 1:1 Langmuir binding model (red traces). The concentrations for all TcoALD variants are expressed in terms of monomer concentrations.

