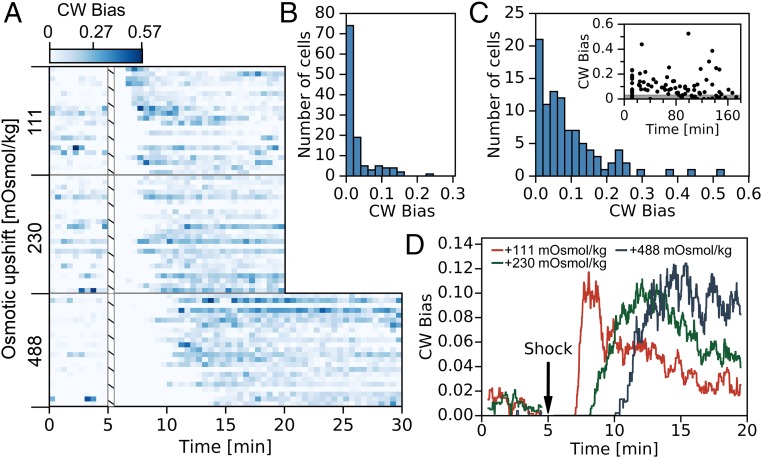
Fig. 2.
(A) Stacked single-cell color maps (histograms) of CW bias for three different shock magnitudes (Left). Bin widths are 30 s. VRB was exchanged for the same buffer with the addition of sucrose at t = 5 min. The white hatched column represents the period of the media exchanged whose duration was 10–15 s. Twenty-two, 24, and 23 cells are given for the 111-mOsmol/kg, 230-mOsmol/kg, and 488-mOsmol/kg conditions, respectively. A, Top shows color map scale. (B and C) Histogram of CW bias for cells (B) before osmotic upshock (in VRB) and (C) after osmotic upshock, administered by exchanging VRB with VRB + 200 mM sucrose. Bin width is set to 0.020. A total of 120 motors (each on a different cell) were used to construct B and 96 motors to construct C. C, Inset plots these 96 single-motor biases against the time after their respective osmotic upshift. Gray shading represents the range between the 25th and the 75th percentile of the CW bias distribution in VRB given in B. (D) Median population CW bias in time, computed from cells given in A, for different shock magnitudes: 111 mOsmol/kg (red), 230 mOsmol/kg (green), and 488 mOsmol/kg (dark blue). Black arrow indicates the time at which hyperosmotic shock was administered.

