Fig. 3.
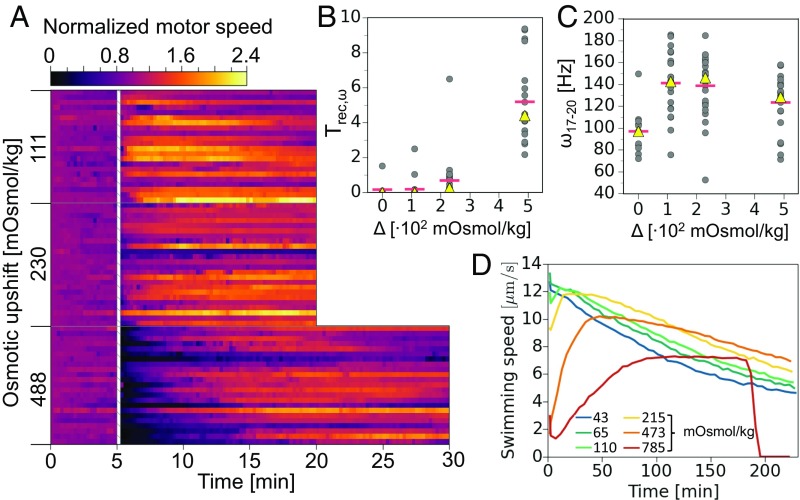
(A) Stacked single-motor (also single-cell) speed histograms, where the motor speed for each BFM is normalized to the average value of the first 15 s. Bin widths are 15 s and the color represents the bin height. Results are grouped by upshock magnitude, as indicated at Left. The white hatched column represents the point where an osmotic shock was performed by exchanging VRB for VRB + sucrose and the flow lasted for 10–15 s. Twenty-two, 24, and 23 cells are given for the 111-mOsmol/kg, 230-mOsmol/kg, and 488-mOsmol/kg conditions, respectively. A, Top shows the color map scale. (B) Time necessary to recover the average value of preshock speed. Red horizontal bars are mean, and yellow triangles are median values, and the graph contains 18, 22, 23, and 20 single-motor data points for the 0-mOsmol/kg, 111-mOsmol/kg, 230-mOsmol/kg, and 488-mOsmol/kg upshocks. One value for the 230-mOsmol/kg condition and three for the 488-mOsmol/kg condition have been excluded from the graph as these motors do not recover average initial speed in the course of recording. The 0-mOsmol/kg condition is a buffer-to-buffer control flush, where we used the same shocking protocol as for osmotic upshocks. (C) Single-motor speeds calculated as 3-min averages corresponding to a section between t = 17 min and t = 20 min in A. The graph contains 12, 22, 24, and 23 single-motor data points for the 0-mOsmol/kg, 111-mOsmol/kg, 230-mOsmol/kg, and 488-mOsmol/kg upshocks. The 0-mOsmol/kg condition contains 12 of 18 control flushes that were at least 20 min long. (D) DDM measurement of swimming speeds following an osmotic shock. Cells were shocked in microfuge tubes and brought into a microscope within 2 min. The key shows shock magnitudes and the mean speed is the average of swimming speeds obtained for each time point in a range of different length scales (Materials and Methods). The systematic error of our measurements is then calculated as the SD of the mean and falls within 5% of the mean value. Here it was not plotted for clarity.

