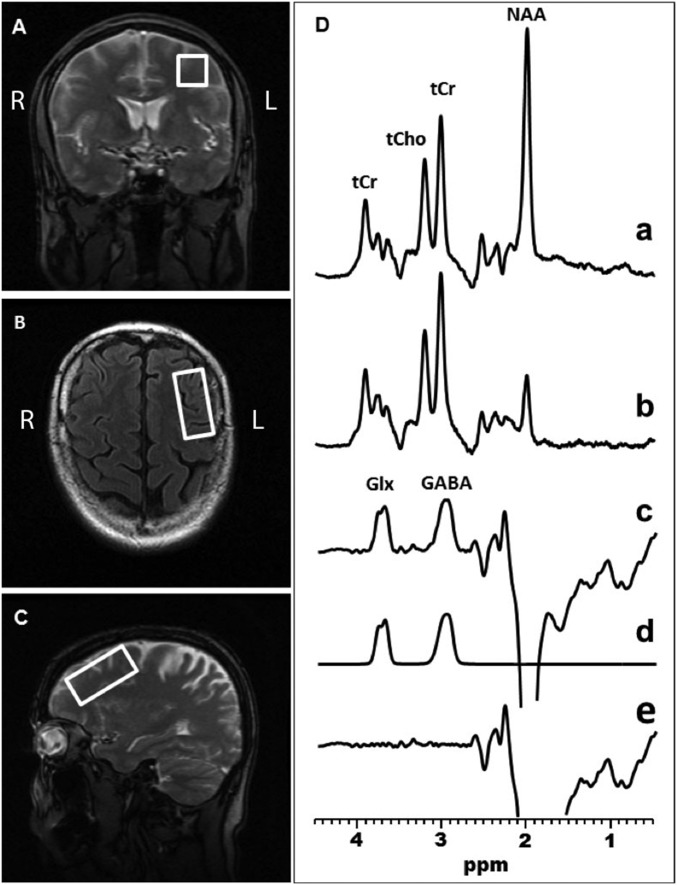
Fig. 3.
Coronal (A), transaxial (B), and sagittal (C) localizer images showing the size and location of the l-DLPFC voxel of interest. (D) Demonstration of in vivo human brain GABA and Glx detection with 1H MRS in the l-DLPFC: single-voxel subspectra acquired in 15 min with the editing pulse on and off and 290 interleaved averages (a and b, 580 total); spectrum (c), difference between spectra a and b showing the edited brain GABA and Glx resonances; spectrum (d), model fitting of the experimental spectrum (c) to obtain the GABA and Glx peak areas; spectrum (e), residual of the difference between spectra c and d.

