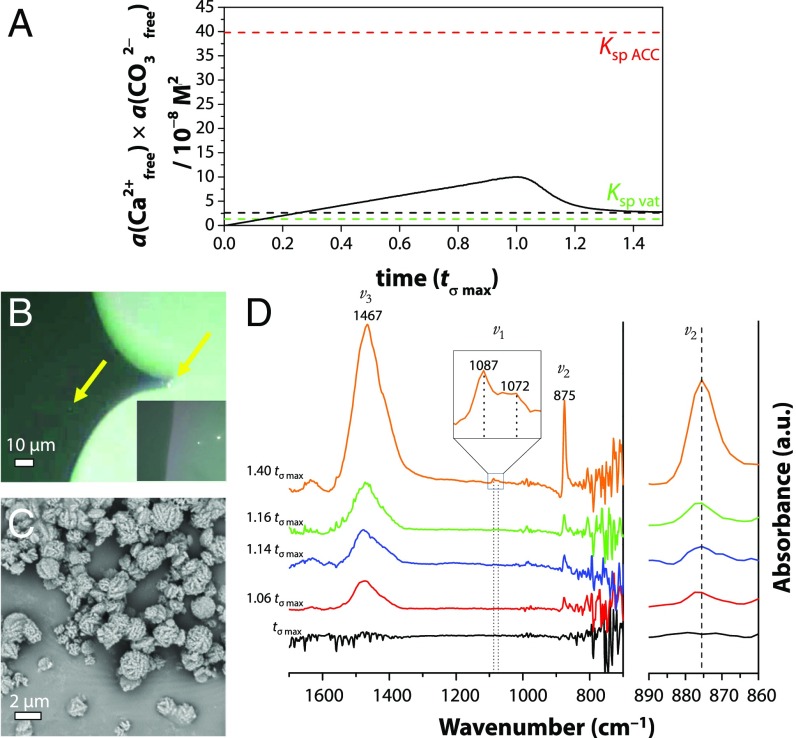
Fig. 8.
(A) Free ion product development vs. normalized time (black solid line) during a typical titration experiment. The black dashed line indicates the solubility product Ksp, compared with the reported solubility product of ACC (Ksp ACC) (33) and vaterite (Ksp vat) (56). (B) POM indicating micrometer-sized entities at 1.03 tσ max (yellow arrows), which show birefringence when the surrounding solution (dark gray) retracts (Inset). (C) SEM at 1.03 tσ max showing a typical spherical–framboidal vaterite morphology. (D) In situ ATR-FTIR spectra from tσ max to 1.40 tσ max showing typical vibrations of vaterite at 875 cm−1 (CO32− ν2 out of plane bend), 1,087/1,072 cm−1 (CO32− ν1 symmetric stretch), and 1,467 cm−1 (CO32−, ν3 asymmetric bond stretch) (57) gradually increasing in time. The Top Inset shows an enlargement of the ν1 peak at 1.40 tσ max, while the spectrum on the far Right displays the magnified ν2 spectral region.

