Fig. 4.
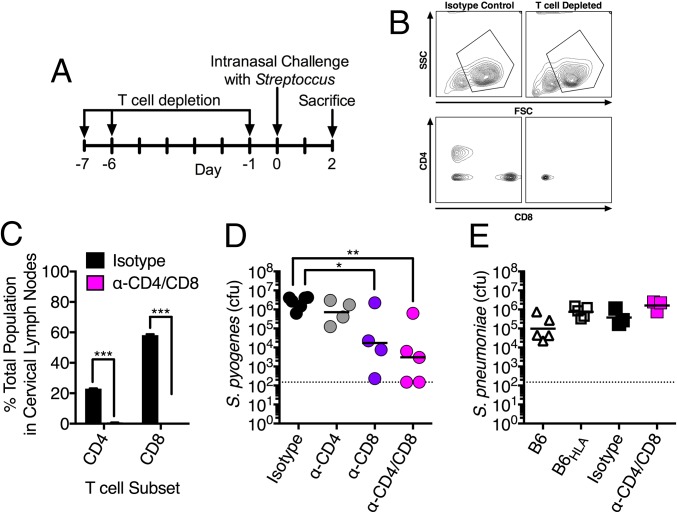
T-cell–dependent nasopharyngeal infection is specific to S. pyogenes. (A) T-cell depletion protocol. (B and C) Flow cytometric analysis of cervical lymph node populations at day 0 post T-cell depletion (n = 3 per group). (B) Representative flow plots for each treatment group stained for CD4 (APC-eFluor 780) and CD8 (PE). Each sample had the lymphocyte population first gated upon using forward scatter (FSC) and side scatter (SSC). (C) Percentage of CD4+ and CD8+ cells to total lymphocyte population in both treatment groups. Data are shown as mean ± SEM. Significance was determined by Student’s t test (***P < 0.001). (D) Nasal challenge with ∼108 cfus of S. pyogenes MGAS8232 of B6HLA mice with indicated treatments [isotype control (LTF-2), black; CD4 depleted (GK1.5), gray; CD8 depleted (YTS169.4), purple; T-cell depleted (GK1.5 + YTS169.4), pink]. (E) Nasal challenge with 107 cfus of S. pneumoniae P1121 of B6 (triangles) or B6HLA mice (squares) with either no treatment (open symbols), isotype control (LTF-2) (black symbols) or T-cell depleted (GK1.5 + YTS169.4) pink]. Data points represent cfus from the complete nasal turbinates (cNTs) of individual mice 48 h postinfection. Horizontal bars represent the geometric mean. The horizontal dotted line indicates limit of detection. Significance was determined by one-way ANOVA with Dunnett’s multiple comparisons post hoc test (*P < 0.05; **P < 0.01).

