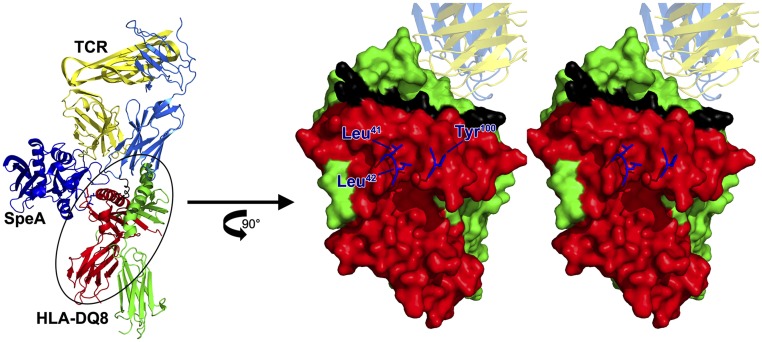
Fig. S1.
Molecular model of SpeA in complex with the mouse Vβ8 TCR and HLA-DQ8. Shown on the Left is the ribbon diagram as depicted in Fig. 2A and generated as described in SI Materials and Methods. Shown on the Right is a stereo (cross-eyed) view of the HLA-DQ8 surface with SpeA amino acid side chains shown for Leu41, Leu42, and Tyr100. Both side chains of Leu41 and Leu42 are predicted to fit within a pocket formed by the α-1 domain of HLA-DQ8.

