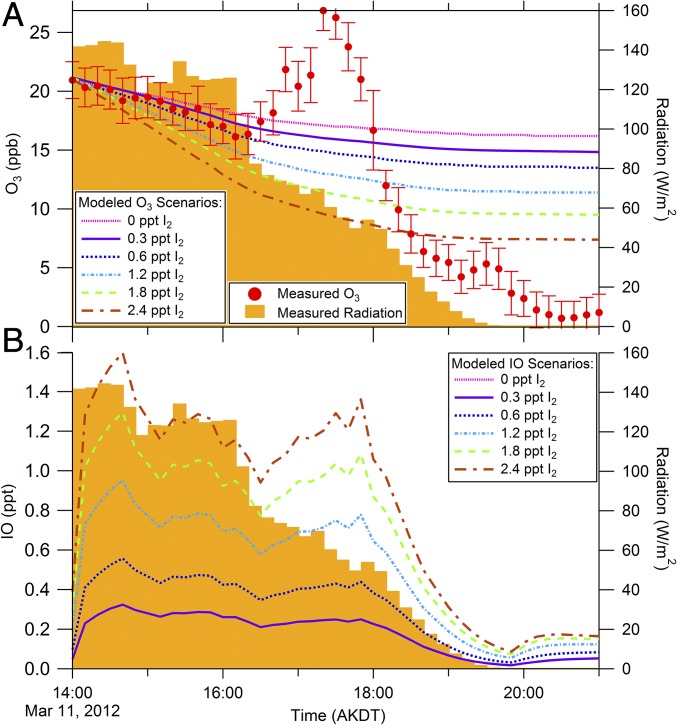
Fig. 5.
Model results show the influence of I2 on (A) tropospheric ozone depletion rates and (B) IO mole ratios. An ozone depletion event occurring on March 11, 2012 was simulated with I2 mole ratios between 0 and 2.4 ppt. Cl2, Br2, and HOBr were constrained to measurements as shown in Fig. S4. (A) Measured O3 with SDs of the 10-min average, and model results showing simulated O3 mole ratios. (B) Simulated IO mole ratios during the same period.

