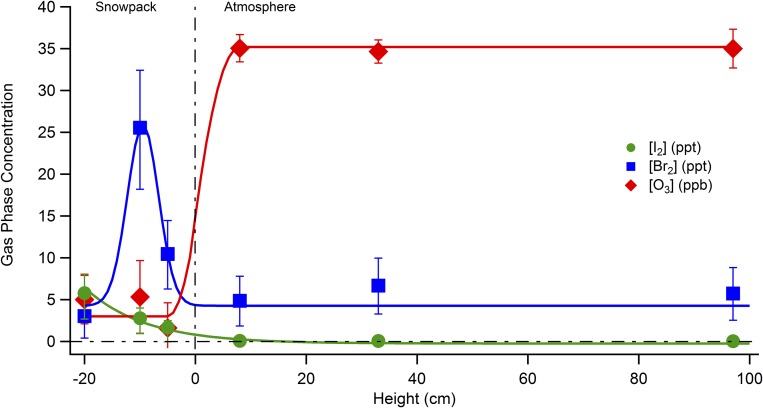
Fig. S1.
Vertical profiles of I2, Br2, and O3 mole ratios within and above the snowpack on February 3, 2014. Measurements were made alternating in and above the snowpack, starting closest to the snowpack surface. Height points are representative of the position of the snow probe inlet in the snowpack during measurement, and do not include possible errors due to air drawn from the other heights within the snowpack.

