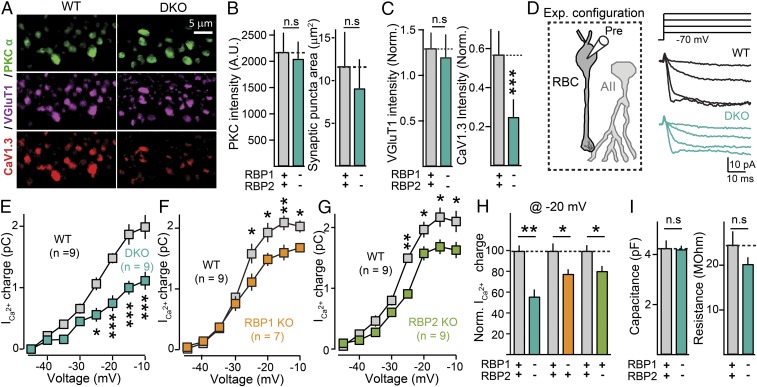
Fig. 4.
Deletion of RBPs reduces Ca2+ currents in presynaptic rod bipolar cells forming ribbon synapses on postsynaptic AII amacrine cells. (A) Selective loss of presynaptic L-type Ca2+ channels from ribbon synapses formed by rod bipolar cells. Representative confocal images of RBP WT (Left) and RBP DKO (Right) retina sections stained for PKCα (green, to identify rod bipolar neurons), VGlut1 (purple, to identify presynaptic terminals), and the L-type Ca2+-channel CaV1.3 (red). (B) Summary graphs of the intensity of PKCα fluorescent signals in WT(gray) and DKO (blue) rod bipolar cell terminals (Left), and terminal size (area, Right) defined by PKC staining. Number of experiments (images/mice): RBP WT, 79/3; RBP DKO, 70/3. (C) Relative vGluT1 (Left) and CaV1.3 (Right) staining intensity normalized by PKCα signals. Number of experiments (images/mice): RBP WT, 79/3; RBP DKO, 70/3. (D) Experimental configuration for Ca2+-current recordings (Left) and representative experiment (Right Top) schematic of depolarization protocol; (Right Bottom) Sample traces for an RBP control (black) and an RBP DKO (blue) bipolar cell. (E) Deletion of RBP1,2 severely impairs presynaptic Ca2+-current density. Summary plot of the Ca2+-current charge transfer over 50 ms as a function of the membrane voltage in RBP1,2 DKO (blue) rod bipolar cells and corresponding littermate controls (gray). (F and G) Incremental contribution of RBP1 (F) and RBP2 (G) to the presynaptic Ca2+-channel density of ribbon synapses. Same as E, but for littermate control (F and G, gray) and RBP1 KO (F, orange) or RBP2 KO (G, green) mice. (H) Summary graphs of the Ca2+-current charge transfer induced by a 50-ms depolarization to −20 mV in RBP1,2 DKO, RBP1 KO, or RBP2 KO mice, normalized to the controls analyzed in the same experiments. Number of experiments as in E–G. (I) Summary graphs of whole-cell capacitance (Left) and input resistance (Right) in the same rod bipolar cells used to measure whole-cell presynaptic Ca2+ currents. Number of experiments as in E. All summary graphs are mean ± SD. Statistical analyses were performed by either Student's t test (B, C, H, and I) or by ANOVA followed by a Bonferroni post hoc test (E–G), comparing RBP DKO with RBP WT (*P < 0.05, **P < 0.01, and ***P < 0.001; n.s., nonsignificant).

