Fig. 5.
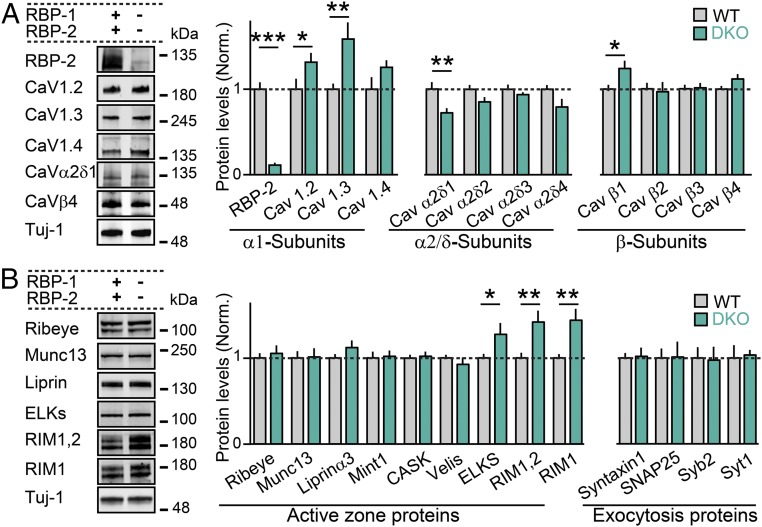
Retina protein levels upon removal of RBPs. (A) Quantitative Western blot analysis of primary and auxiliary L-type Ca2+-channel subunits in the mouse retina. (Left) Images of representative blots. (Right) Summary graphs for six RBP WT and seven RBP DKO experiments. (B) Same as in A, but for active zone and proteins involved in vesicle exocytosis. Number of experiments: six for WT retinas; seven for DKO retinas. All summary graphs are means ± SD. Statistical analyses were performed by Student’s t test comparing RBP DKO with RBP WT (*P < 0.05, **P < 0.01, and ***P < 0.001; n.s., nonsignificant).

