Fig. 6.
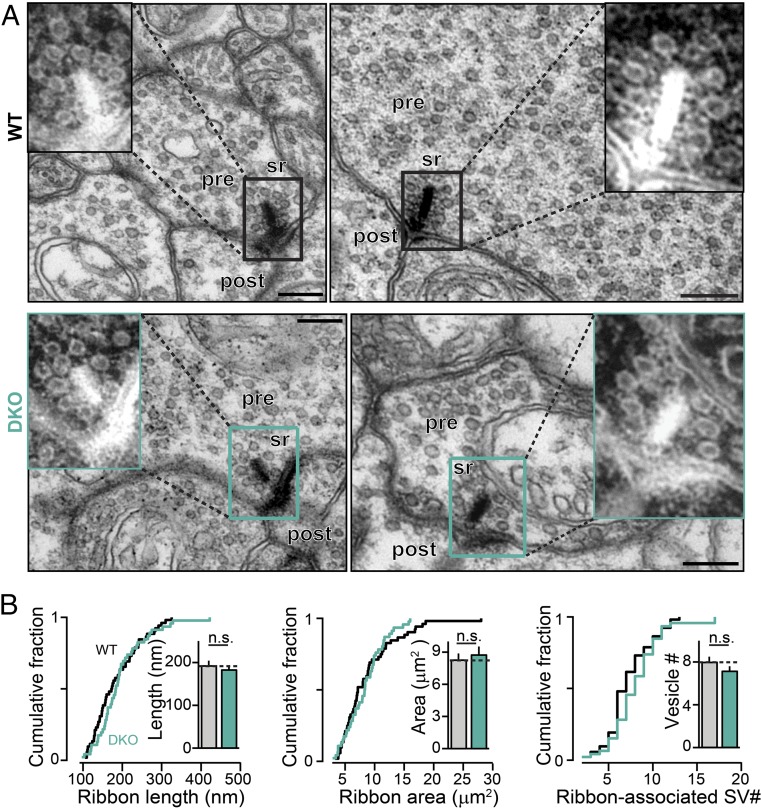
Deletion of RBPs does not alter the ultrastructure of ribbon synapses. (A) High-resolution transmission electron microscopy images of retinal ribbon synapses in WT (Top) and RBP DKO (Bottom) retinas. (Insets) Enlarged images of the synaptic ribbons for each micrograph, with inverted contrast for better visualization of synaptic ribbons and associated vesicles. (Scale bar: 200 nm.) Post, postsynaptic; pre, presynaptic; sr, synaptic ribbon. (B) Cumulative distribution plots and bar graphs of the ribbon length (Left), ribbon area (Center), and total number of ribbon-associated vesicles (Right) in WT and RBP DKO retinas. n (synapses/mice) = 72/3 for WT; 97/3 for DKO sample. Summary graphs are means ± SD; statistical analyses were performed by the Kolmogorov–Smirnov (K-S) test (cumulative distributions) or Student’s t test (bar graphs; n.s., nonsignificant).

