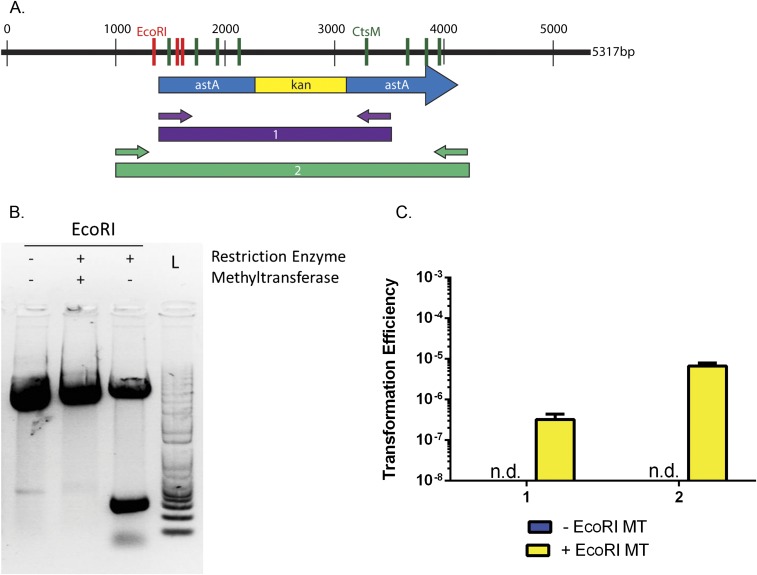
Fig. S3.
Digests of plasmids treated with M. EcoRI and PCR transformation data. (A) Diagram of pJMB202 and PCR products generated from this plasmid. GAATTC (M.EcoRI sites) are shown in red, and other RAATTY sites are shown in green. Small arrows indicate primers. (B) pJMB202 was treated as indicated. DNA was then electrophoresed and visualized using Gel Red. (C) PCR fragments derived from pJMB202 as indicated in A were methylated in vitro using M.EcoRI. ctsM+ cells were then transformed with DNA that either had not been methylated (blue) or had been methylated (yellow). Transformation efficiency was calculated as described in Materials and Methods. The dashed line indicates the limit of detection. n.d. indicates that colonies were not detected. Error bars indicate SD.

